Data &
Technology
Research
Reports
Report Solutions
Reports Library
Actionable
Strategies
Free
Resources
Simple Backtest Calculator
Simple Seasonality Calculator
The Kelly Criterion Calculator
Sentiment Geo Map
Public Research Reports
Free Webinar
Pricing
Company
About
Meet Our Team
In the News
Testimonials
Client Success Stories
Contact
Log inLoginSign up
< BACK TO ALL REPORTS

Nearing Records for Super Strong Trends

Jason Goepfert
2021-08-18
The Dow Industrials and S&P 500 have been so far above their 200-day moving averages, for so long, that both indexes are nearing historic levels of such a sustained trend. Their few precedents often preceded medium-term weakness.

This has been a year for the record books, as we've seen from several different perspectives lately. We can add to that the length of super-strong trends in both the S&P 500 and Dow Industrials.

The S&P has been more than 8% above its 200-day moving average since last fall.

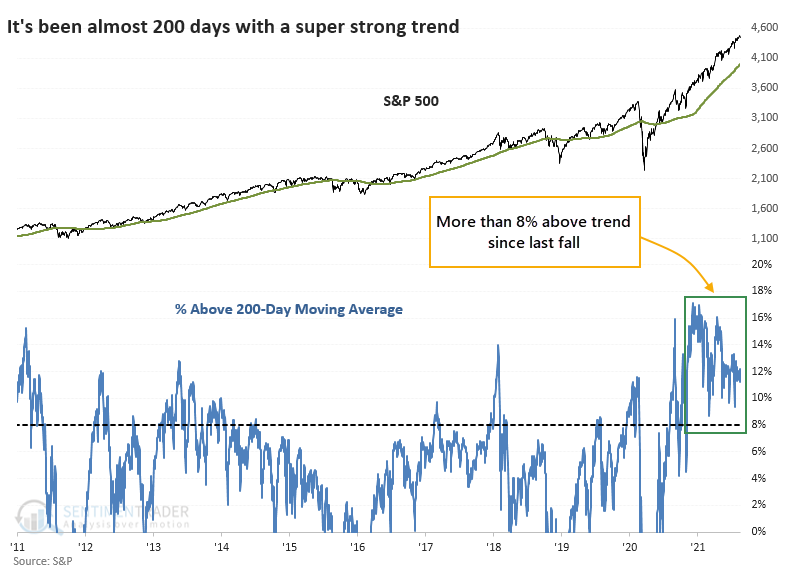
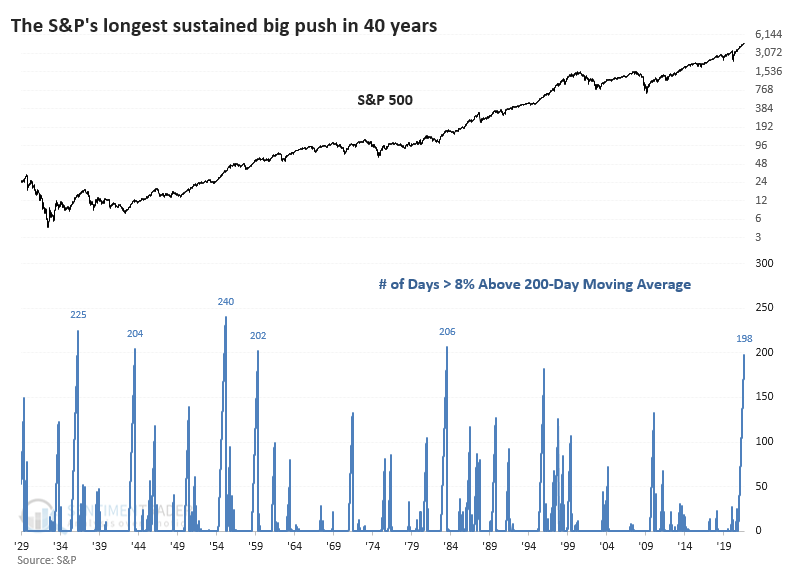
At nearly 200 consecutive trading days this far above trend, the current streak ranks among the best in the S&P's history and the longest in 40 years.

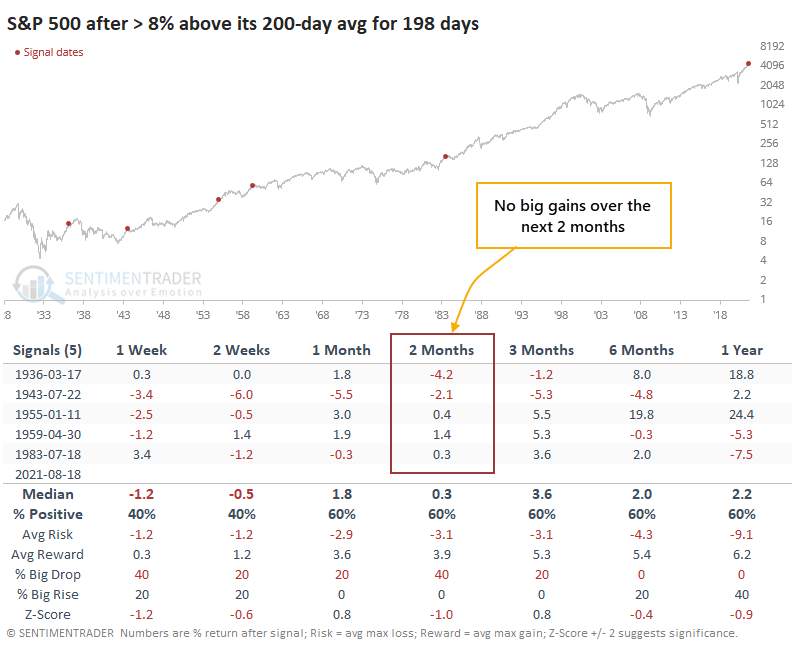
By the time it reached the current length, other super-strong trends saw buyers take a break.

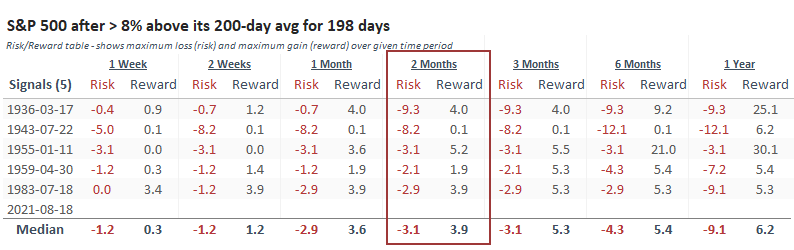
Looking at the Risk/Reward Table, the 2-month time frame was uninspiring. Three of the five signals had a higher risk than reward, and the other two weren't much better.

The Dow hasn't been quite as strong, holding "only" 6% above its long-term moving average. Even the momentum market of 2017 couldn't match this.

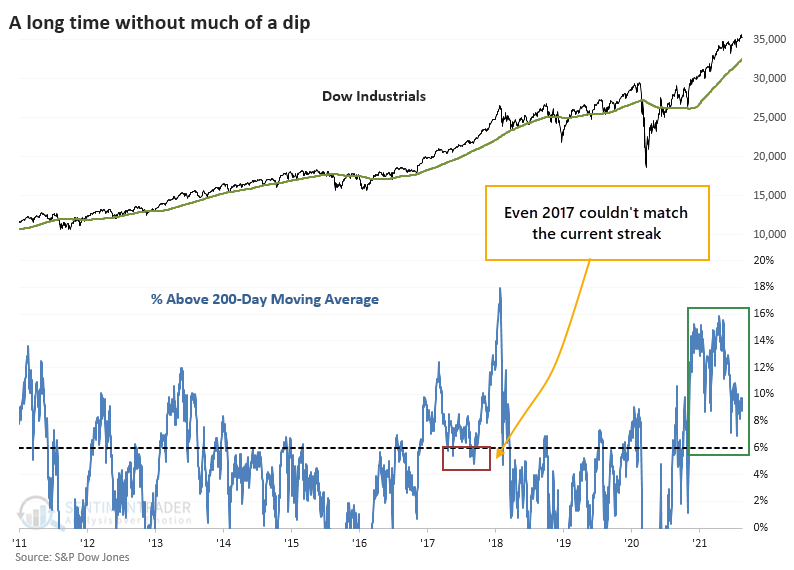
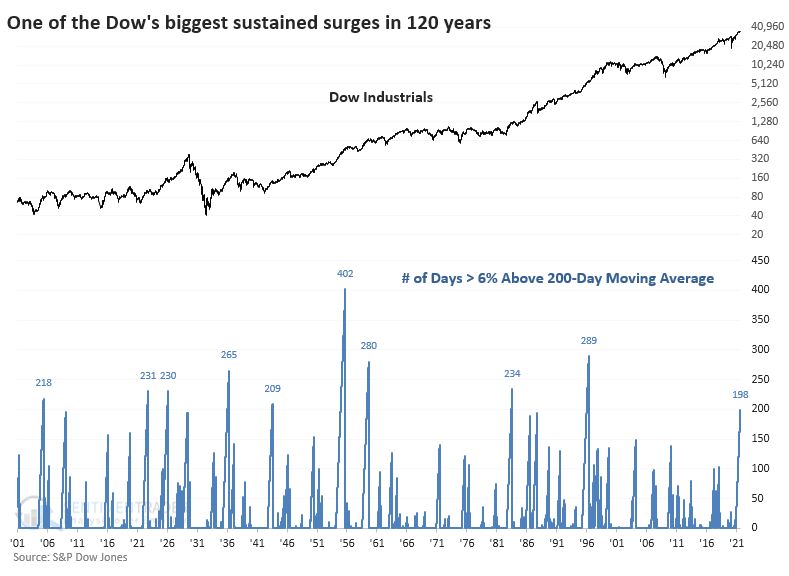
For the Dow, this ranks among the longest super-strong trends in 120 years.

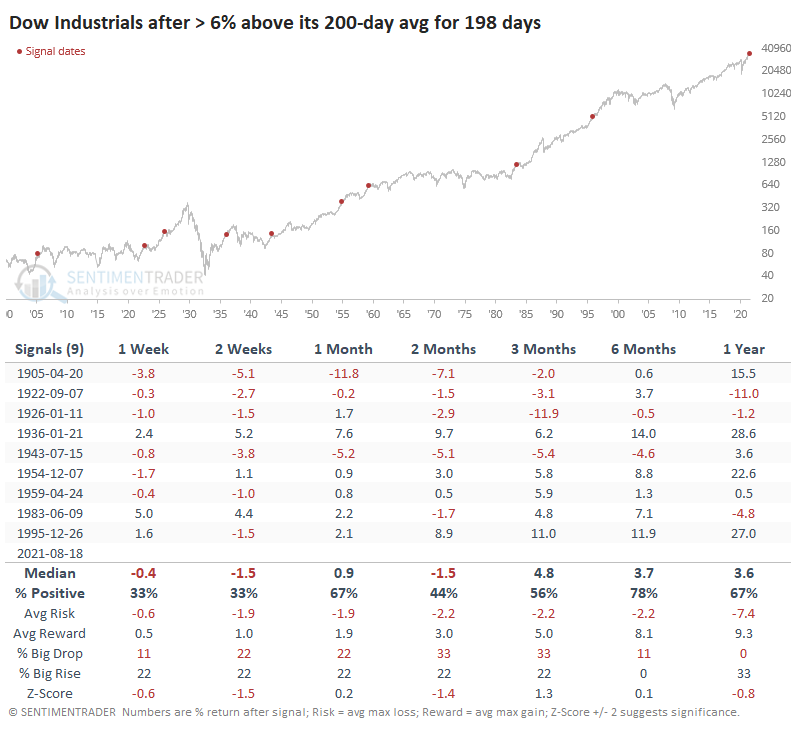
The Dow also tended to struggle with inconsistent returns after such a massive run. Only 3 of the 9 signals ended up leading to runaway bull markets, with the others preceding negative or tepid short- to medium-term returns.

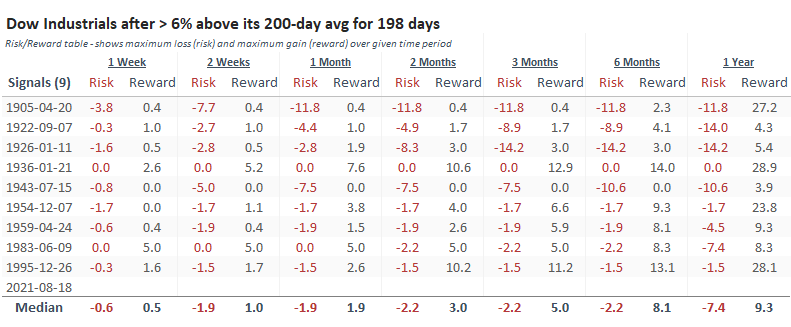
The Risk/Reward Table for the Dow shows that the index had more risk than reward over the next month after 5 of the 9 signals. It is worth noting that since 1950, the Dow's four precedents led to shallow risk up to six months later and at least +8% of upside.

There is no question that momentum in 2021 has been impressive and on the cusp of record-breaking in some respects. Looking for comparisons brings up only small sample sizes, making it tough to rely on for guidance.

Still, the momentum streaks that we've looked at from different perspectives have been somewhat consistent in their message - by the time buyers have persisted to the degree they have now, for as long as they have now, future returns over the coming months were mediocre at best, and often negative. But whatever pullbacks or corrections they preceded tended to be limited, with almost none of them leading to sustained bear markets.

Sorry, you don't have access to this report

Upgrade your subscription plan to get access
Go to Dasboard
DATA &
TECHnologies
IndicatorEdge
‍
BackTestEdge
‍
Other Tools
‍
DataEdge API
RESEARCH
reports
Research Solution
‍
Reports Library
‍
actionable
Strategies
Trading Strategies
‍
Smart Stock Scanner
‍
FREE
RESOUrCES
Simple Backtest
Calculator
Simple Seasonality
Calculator
The Kelly Criterion
Calculator
Sentiment Geo Map
‍
Public Research Reports
‍
Free Webinar
COMPANY
‍
About
‍
Meet our Team
‍
In the News
‍
Testimonials
‍
Client Success Stories
Pricing
Bundle pricing
‍
Announcements
‍
FAQ
© 2024 Sundial Capital Research Inc. All rights reserved.
Setsail Marketing
TermsPrivacyAffiliate Program
Risk Disclosure: Futures and forex trading contains substantial risk and is not for every investor. An investor could potentially lose all or more than the initial investment. Risk capital is money that can be lost without jeopardizing ones’ financial security or life style. Only risk capital should be used for trading and only those with sufficient risk capital should consider trading. Past performance is not necessarily indicative of future results.

Hypothetical Performance Disclosure: Hypothetical performance results have many inherent limitations, some of which are described below. No representation is being made that any account will or is likely to achieve profits or losses similar to those shown; in fact, there are frequently sharp differences between hypothetical performance results and the actual results subsequently achieved by any particular trading program. One of the limitations of hypothetical performance results is that they are generally prepared with the benefit of hindsight. In addition, hypothetical trading does not involve financial risk, and no hypothetical trading record can completely account for the impact of financial risk of actual trading. for example, the ability to withstand losses or to adhere to a particular trading program in spite of trading losses are material points which can also adversely affect actual trading results. There are numerous other factors related to the markets in general or to the implementation of any specific trading program which cannot be fully accounted for in the preparation of hypothetical performance results and all which can adversely affect trading results.

Testimonial Disclosure: Testimonials appearing on this website may not be representative of other clients or customers and is not a guarantee of future performance or success.