Data &
Technology
Research
Reports
Report Solutions
Reports Library
Actionable
Strategies
Free
Resources
Simple Backtest Calculator
Simple Seasonality Calculator
The Kelly Criterion Calculator
Sentiment Geo Map
Public Research Reports
Free Webinar
Pricing
Company
About
Meet Our Team
In the News
Testimonials
Client Success Stories
Contact
Log inLoginSign up
< BACK TO ALL REPORTS

Nasdaq's Summation Index turns positive for first time in months

Jason Goepfert
2021-11-09
Momentum in stocks on the Nasdaq exchange has been positive enough to turn its McClellan Summation Index positive for the first time in months. Previous signals preceded long-term gains in the Composite index.

Key points:

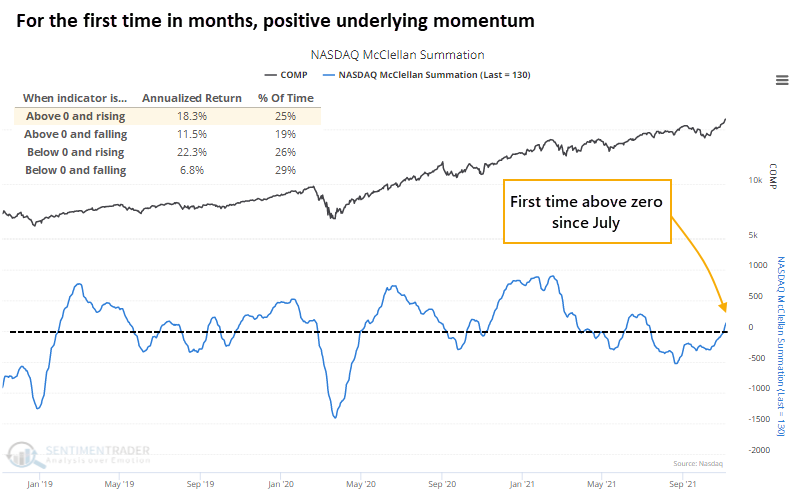
  • The McClellan Summation Index for the Nasdaq has turned positive
  • This ends a streak of several months in negative territory
  • Moves above zero have led to strong 1-year forward returns in the Composite

Internal Nasdaq momentum is positive for the first time since July

For the first time in months, the momentum in securities traded on the Nasdaq exchange has turned positive. After a furious rally to start the year, so many stocks were churning that breadth on the Nasdaq couldn't surpass its highs at the start of the year. By mid-summer, it turned outright negative and stayed there until last week.

This has ended a streak of 77 days in negative territory for the Nasdaq McClellan Summation Index, among the longest streaks since the end of the Global Financial Crisis. 

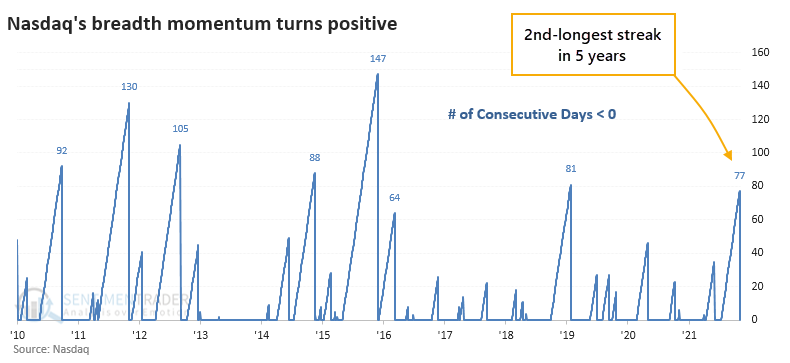
Only 6 other periods saw the Nasdaq's Summation Index stay in negative territory for longer. After those streaks ended, the Nasdaq Composite gained an average of nearly 19% at some point within the next year.

Returning momentum coincides with new highs

What's especially notable about the current flip to positive momentum is that it triggered as the Nasdaq Composite was on a run to new highs. Since 1986, there have been 8 similar signals.

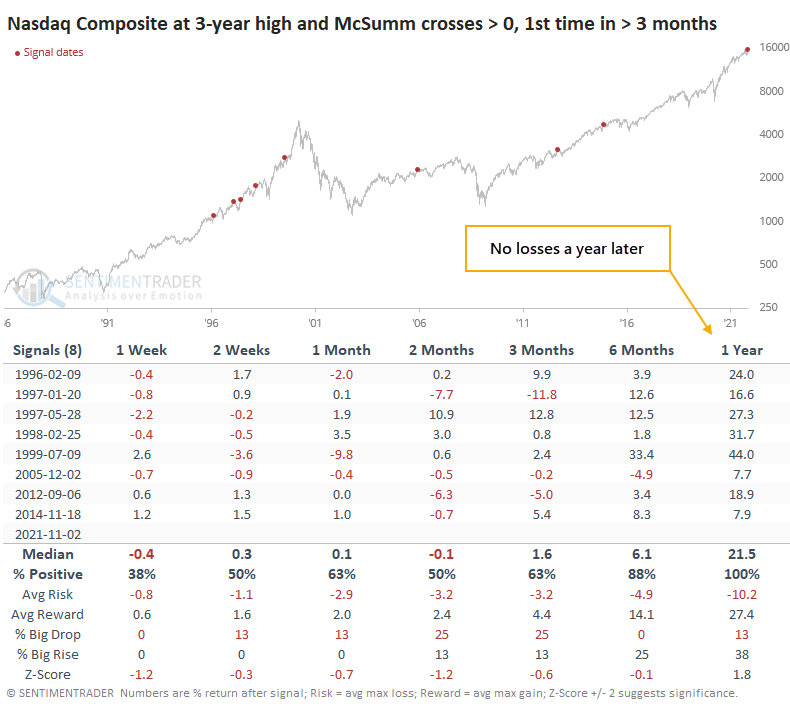
After those signals, the Nasdaq tended to chop around for a while. All 8 of them saw a negative return in the Composite at some point over the next 2-8 weeks. But all 8 of them also recovered strongly, showing a positive return over the next year each time. The Composite's median return a year later was 21.5%, nearly 2 standard deviations above random.

If we expand the sample size by including times when the Nasdaq was at least out of correction territory, results were similar.

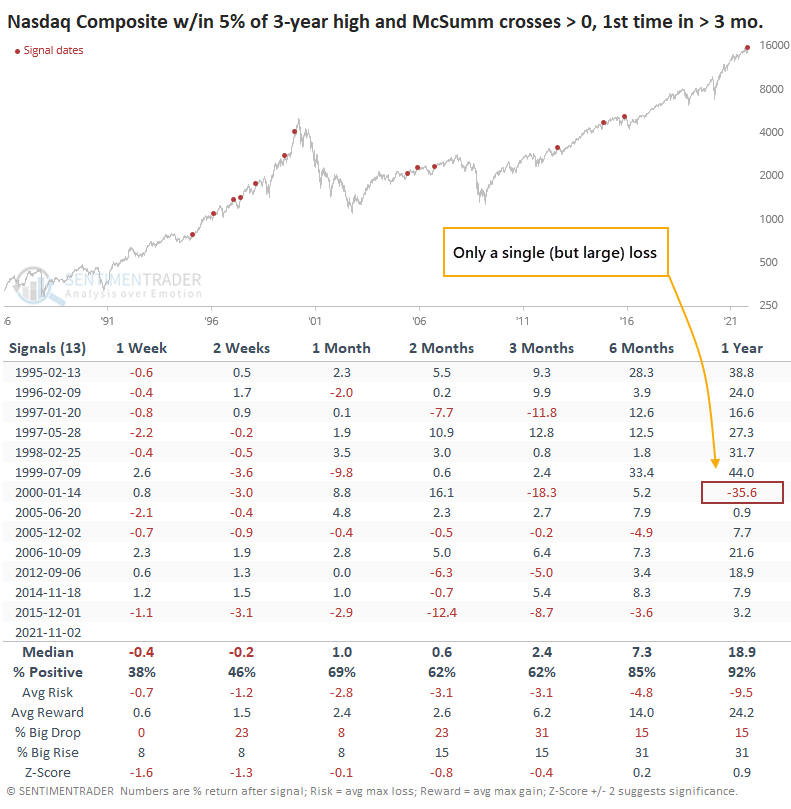
After these signals, the Nasdaq often encountered some short-term pushback as sellers saw a chance to get out after suffering losses. But over the next 6-12 months, positive results were the norm. A year later there was only a single loss, though it was a massive one.

What the research tells us...

When the McClellan Summation Index for any sector or index is in positive territory and rising, it tends to be the best possible scenario for future returns. That's where the Nasdaq is sitting now. While short-term returns can be poor, or inconsistent at best, long-term returns have been very positive after the Summation Index turns positive following months in negative territory.

Sorry, you don't have access to this report

Upgrade your subscription plan to get access
Go to Dasboard
DATA &
TECHnologies
IndicatorEdge
‍
BackTestEdge
‍
Other Tools
‍
DataEdge API
RESEARCH
reports
Research Solution
‍
Reports Library
‍
actionable
Strategies
Trading Strategies
‍
Smart Stock Scanner
‍
FREE
RESOUrCES
Simple Backtest
Calculator
Simple Seasonality
Calculator
The Kelly Criterion
Calculator
Sentiment Geo Map
‍
Public Research Reports
‍
Free Webinar
COMPANY
‍
About
‍
Meet our Team
‍
In the News
‍
Testimonials
‍
Client Success Stories
Pricing
Bundle pricing
‍
Announcements
‍
FAQ
© 2024 Sundial Capital Research Inc. All rights reserved.
Setsail Marketing
TermsPrivacyAffiliate Program
Risk Disclosure: Futures and forex trading contains substantial risk and is not for every investor. An investor could potentially lose all or more than the initial investment. Risk capital is money that can be lost without jeopardizing ones’ financial security or life style. Only risk capital should be used for trading and only those with sufficient risk capital should consider trading. Past performance is not necessarily indicative of future results.

Hypothetical Performance Disclosure: Hypothetical performance results have many inherent limitations, some of which are described below. No representation is being made that any account will or is likely to achieve profits or losses similar to those shown; in fact, there are frequently sharp differences between hypothetical performance results and the actual results subsequently achieved by any particular trading program. One of the limitations of hypothetical performance results is that they are generally prepared with the benefit of hindsight. In addition, hypothetical trading does not involve financial risk, and no hypothetical trading record can completely account for the impact of financial risk of actual trading. for example, the ability to withstand losses or to adhere to a particular trading program in spite of trading losses are material points which can also adversely affect actual trading results. There are numerous other factors related to the markets in general or to the implementation of any specific trading program which cannot be fully accounted for in the preparation of hypothetical performance results and all which can adversely affect trading results.

Testimonial Disclosure: Testimonials appearing on this website may not be representative of other clients or customers and is not a guarantee of future performance or success.