Products
SentimenTrader Trading Tools
‍
Backtest Engine
My Trading Toolkit
Correlation Analysis
Seasonality
Market Prediction
Indicators & Data API
‍
Proprietary Indicators & Charts
Market Data API
Strategies & Scanner
‍
50+ Trading Strategies
Smart Stock Scanner
Smart Option Scanner
Research Reports
‍
Research Solutions
Reports Library
Free Resources
Simple Backtest Calculator
Simple Seasonality Calculator
The Kelly Criterion Calculator
Sentiment Geo Map
Public Research Reports
Education
Sentiment Indicators
Technical Indicators
Pricing
Company
About
In the News
Testimonials
Client Success Stories
Contact
Log inLoginSign up
< BACK TO ALL REPORTS

Nasdaq's recovery attempt

by Sentimentrader
2026-04-08
The Nasdaq 100 is recovering from its correction with a massive breadth thrust. Historically, when QQQ short-term breadth surges from <30% to >70% in five days, the index posts an 80% win rate over the next year.

Key points

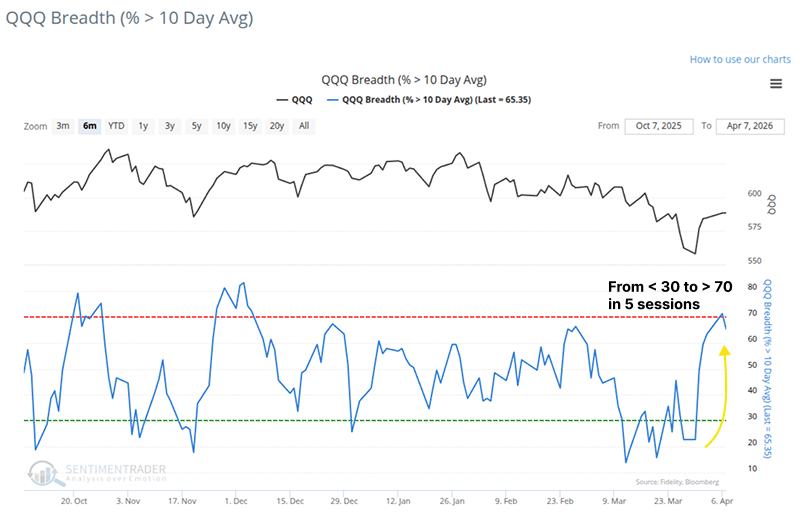
  • After officially entering correction territory, the Nasdaq 100 has staged a rapid recovery, with short-term market breadth surging from extremely washed-out levels.
  • Historically, when the percentage of QQQ components trading above their 10-day moving average rockets from under 10% to over 70% in just five days, the index boasts an 80% win rate over a one-year timeframe.

Nasdaq's recovery attempt

Recent market action has been heavily dominated by geopolitics, leaving investors on edge as they parse daily headlines to determine whether we will see a pause in war or further escalation.

The SentimenTrader team emphasizes two indispensable market analysis concepts in our research reports, among many others: the strategic use of composite models and the identification of reversal signals.

The significance of a composite indicator lies in its ability to minimize the risk of failure, a common drawback when relying on a single metric. Furthermore, the application of reversal signals enhances the risk-reward ratio of trading setups, helping traders avoid the peril of trying to "catch a falling knife."

A previous report noted that the Nasdaq 100 had officially fallen into correction territory, and that initial 10% drawdowns from multi-year highs t

Sorry, you don't have access to this report

Upgrade your subscription plan to get access
Go to Dasboard
PRODUCTS
SentimenTrader
Trading Tools
Indicators & Data API
‍
Strategies & Scanner
‍
Research Reports
FREE
RESOUrCES
Simple Backtest
Calculator
Simple Seasonality
Calculator
The Kelly Criterion
Calculator
Sentiment Geo Map
‍
Public Research Reports
‍
Education
Sentiment Indicators
‍
Technical Indicators
‍
Pricing
Bundle pricing
‍
FAQ
‍
Announcements
‍
COMPANY
‍
About
‍
In the News
‍
Testimonials
‍
Client Success Stories
CONTACT
‍
General Inquiries
‍
Media Inquiries
‍
Financial Professionals Inquiries
‍
© 2026 Sundial Capital Research Inc. All rights reserved.
Setsail Marketing
TermsPrivacyAffiliate Program
Risk Disclosure: The information and tools provided are for research and analytical purposes only and are not intended as investment advice. Market analysis involves uncertainty, and outcomes may differ from expectations. Users should conduct their own due diligence and consider their individual circumstances before making any financial decisions. Past performance is not necessarily indicative of future results.

Hypothetical Performance Disclosure: Hypothetical performance results have many inherent limitations, some of which are described below. No representation is being made that any account will or is likely to achieve profits or losses similar to those shown; in fact, there are frequently sharp differences between hypothetical performance results and the actual results subsequently achieved by any particular trading program. One of the limitations of hypothetical performance results is that they are generally prepared with the benefit of hindsight. In addition, hypothetical trading does not involve financial risk, and no hypothetical trading record can completely account for the impact of financial risk of actual trading. for example, the ability to withstand losses or to adhere to a particular trading program in spite of trading losses are material points which can also adversely affect actual trading results. There are numerous other factors related to the markets in general or to the implementation of any specific trading program which cannot be fully accounted for in the preparation of hypothetical performance results and all which can adversely affect trading results.

Testimonial Disclosure: Testimonials appearing on this website may not be representative of other clients or customers and is not a guarantee of future performance or success.