
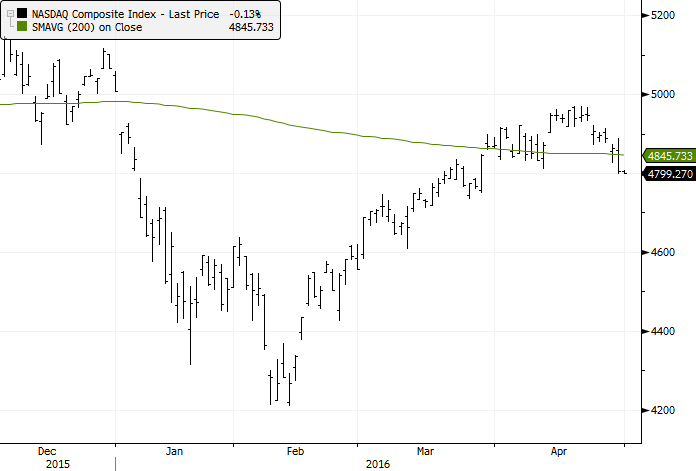
Nasdaq Composite Loses Its 200-Day Avg

For the first time in a couple of weeks, the tech-heavy Nasdaq Composite index has traded below its 200-day average. The simple technical indicator is often used as a filter to determine whether a market is in a bull or bear market environment.
Since its inception in 1971, when the Composite was above its 200-day average (which accounted for 68% of the days), it advanced at an annualized 16.9%. When it was below its average, it returned an annualized 0.0%. In other words, it didn't pay to be invested in tech when it was below its long-term average.
Let's go back to its inception and look for other times that it crossed below its average for the first time in at least two weeks, and the average was flat. This gives us dates when the trend has been range-bound, and the index started to decline.
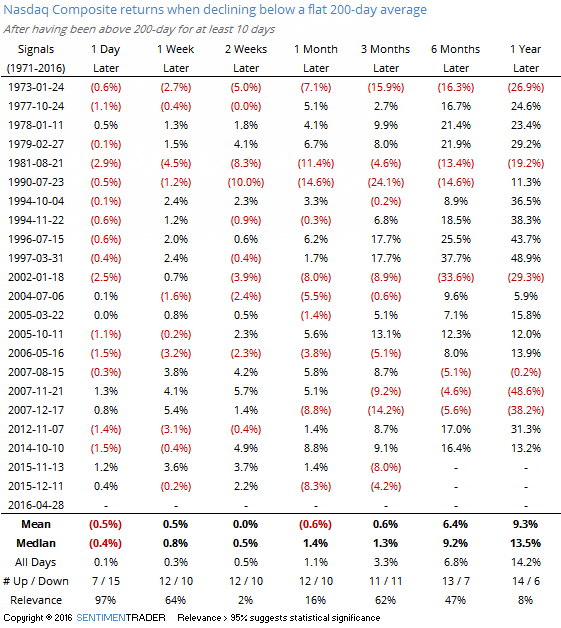
The results are a bit troubling but not disastrous. Up to three months later, the index was negative as much as it was positive and while it sported a positive average return, it was well below random. There was wide variability among the returns, however, which is why the "Relevance" figure is relatively low. There were some massive gains among the precedents along with some massive losses.
Overall, we'd consider this to be an indicator of an unfavorable market environment, but not enough to be an outright sell signal.