
NASDAQ Buying Climaxes Send a Message

Key points:
- Not every "squiggle" from every indicator "means something." Some indicators "speak" only rarely, but when they do, they typically say something useful
- Our Nasdaq 100 Buying Climaxes indicator recently crossed a significant threshold
- Significant market gains have typically followed the signal detailed below; however, the signal itself is best considered as "weight of the evidence" and not as a "set it and forget it" buy signal
A closer look at Nasdaq Buying Climaxes
Our Nasdaq 100 Buying Climaxes indicator shows the number of Nasdaq 100 stocks that reached a 52-week high during the week and then closed below their prior week's close. It suggests a climax in investor buying interest, a sign of exhaustion. There is another way to utilize this data, and that is to note a lack of buying climaxes, followed by an increase from a low level.
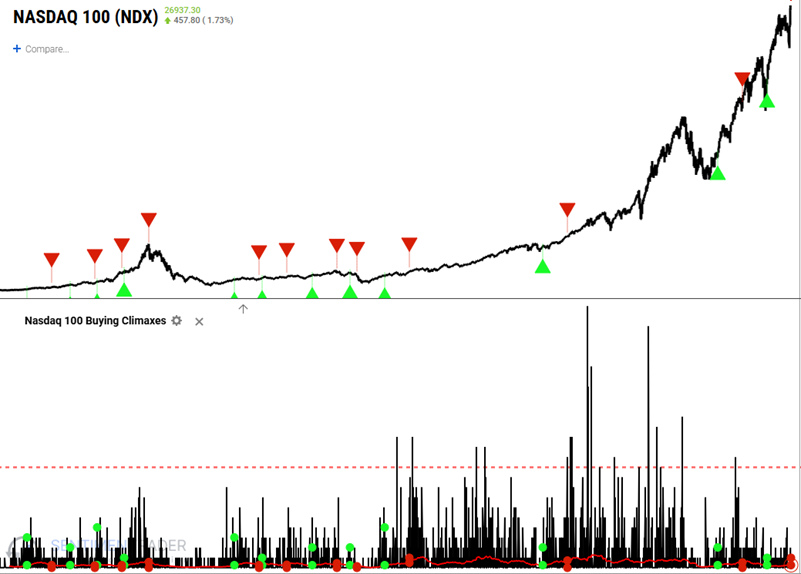
The chart below highlights all dates when the 150-day moving average of the Nasdaq 100 Buying Climaxes indicator crossed above 0.24. The most recent signals occurred on May 7, 2025, and February 17th, February 23rd, and April 21st of 2026.
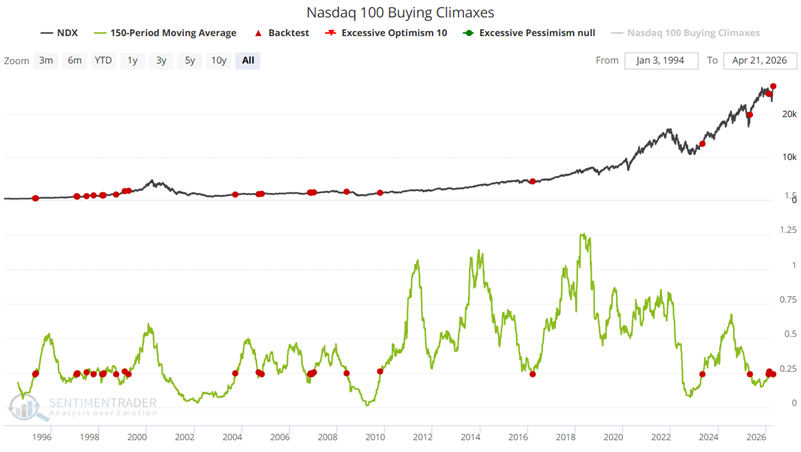
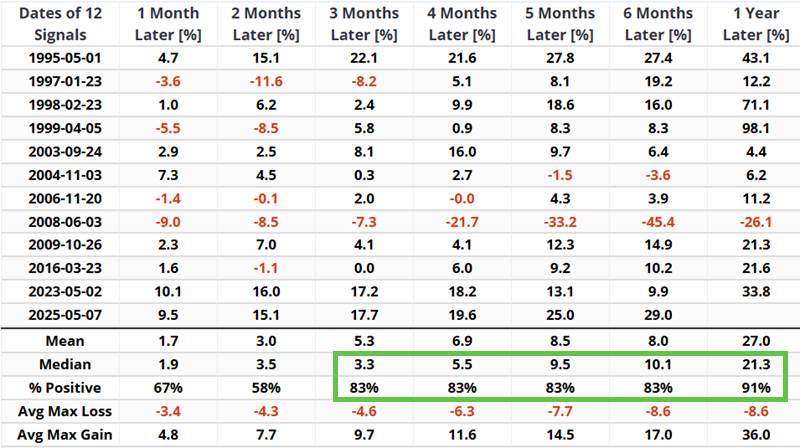
The table below summarizes Nasdaq 100 Index performance following the signal dates highlighted above, including all overlapping signals.
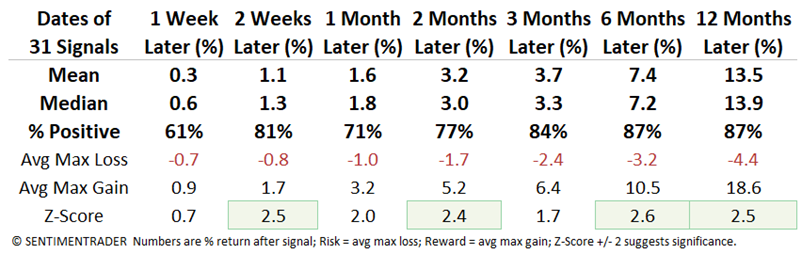
The table below displays the subsequent performance of the Nasdaq 100 Index following all signals.
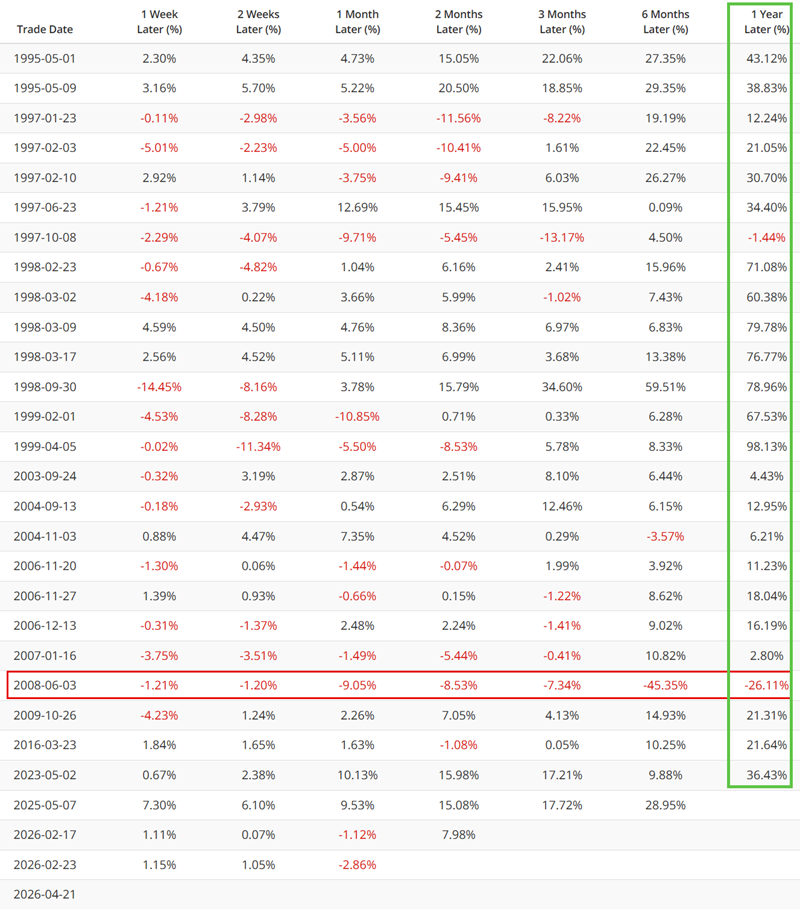
This is the type of indicator that speaks only infrequently, but when it does, it often says something useful. Two things to note:
- The 1-Year Returns were often well above average
- The June 2008 signal reminds us that there are never any guarantees and that investors are never relieved of their obligation to plan for controlling risk
Creating a systematic approach
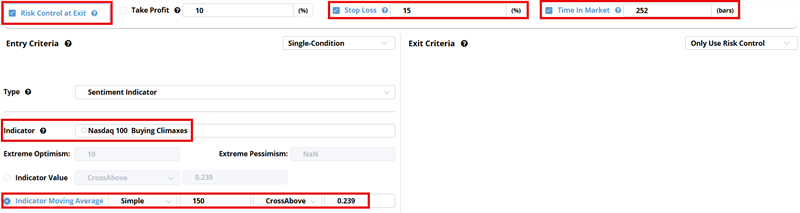
Let's take a look at a systematic approach to using Nasdaq 100 Buying Climaxes. Here are the simple test rules:
- Buy the Nasdaq 100 Index when the 150-day moving average of the Nasdaq 100 Buying Climaxes indicator crosses above 0.24.
- We will use a 15% stop-loss (i.e., if an open trade reaches a loss of 15% or more, we will exit the trade)
- If no stop-loss is triggered, exit the trade after 252 trading days (i.e., roughly one year)
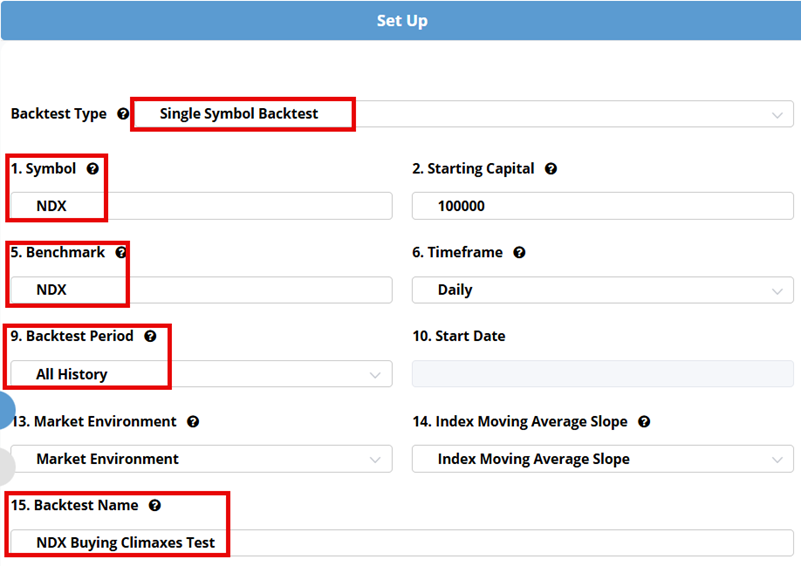
The input screens to set up this test in Backtest Edge appear below.
The signals from this test appear below. Note that the most recent signals on February 17th, February 23rd, and April 21st do not register in this test, because the signal on May 7th, 2025, is still within its 252-day holding period.
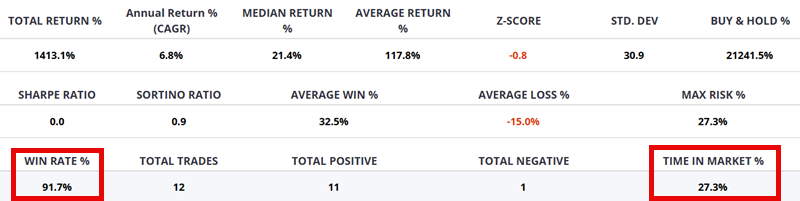
The table below summarizes the test results. Note that this "strategy" is only in the market 27% of the time, so it is not a good choice for use as a standalone strategy. On the other hand, the 91.7% Win Rate suggests this may be a useful tool as a confirmation signal, i.e., as weight of the evidence.
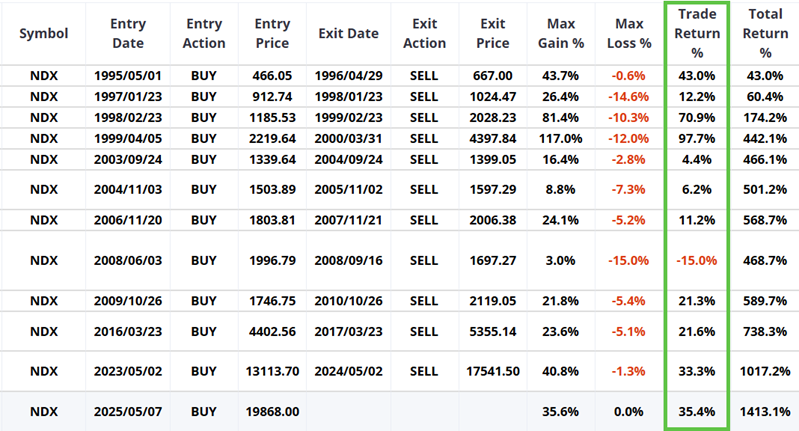
The table below displays the hypothetical trade-by-trade results. Note that the loss following the 2008/06/03 signal would have been much worse (greater than -40%) without the 15% stop-loss. This is another reason an investor should view this method as a weight-of-the-evidence approach, not as a "set it and forget it" buy signal.
Finally, the table below shows that this method has a compelling Win Rate from 3 months to 1 Year. This suggests that the signal may be useful to both swing traders and longer-term investors as a confirmation tool.
What the research tells us…
In many cases, it can be helpful to "look below the surface" of the market. Indicators like the Nasdaq 100 Buying Climaxes zero in on a specific type of pattern or activity across a specific, influential segment of the market. Most of the time, it says nothing. However, on other occasions, indicators like this can "speak very loudly." The 2008 signal reminds us that nothing is guaranteed in the market and that risk control is always essential. That said, based on the overall results highlighted above, this indicator suggests a strong possibility of higher stock prices over the next 12 months.