
NAAIM Index at Elevated Levels

Key Points
- Not all indicators are suitable for use as standalone trading systems.
- Many indicators work best to strengthen the persuasiveness of bullish or bearish outlooks.
- The NAAIM Exposure Index indicates that professional investors are becoming more bullish. Historical data for this index suggests this is a positive development.
Most Indicators Are Like a Brick in the Wall, Not a One-Size-Fits-All Solution
Traders often mistakenly assume that every signal from an indicator is an "action command"-i.e., a buy or sell signal. In reality, signals from most indicators are typically best used as evidence to support a bullish or bearish thesis.
The NAAIM Exposure Index
NAAIM stands for the National Association of Active Investment Managers. As the name suggests, this is a group composed of professional investors. The chart below shows the weekly readings of the NAAIM Exposure Index.
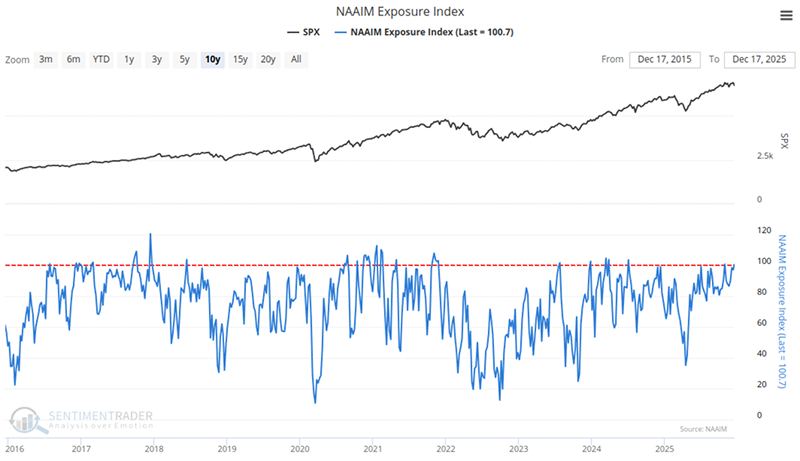
Excerpt from the National Association of Active Investment Managers website:
NAAIM member firms (all active money managers) are asked each week to provide a number representing their overall equity exposure at the close of business on a specific day (currently Wednesday). As shown below, responses from firms can vary widely. All responses are aggregated and averaged to derive the average long (or short) position of all NAAIM fund managers.
Response Range:
- 200% leveraged short
- 100% fully short
- 0% cash or hedged to market neutral
- 100% fully invested
- 200% leveraged long
Investor surveys often act as contrarian indicators because investors tend to grow more optimistic as markets rise and more pessimistic as markets fall. As we will see, the NAAIM Exposure Index typically runs counter to this trend. While even professional money managers are susceptible to the temptations of fear and greed, the investors tracked by the NAAIM Exposure Index are better at overcoming these emotions. This is reflected in the fact that, although the sample size is too small to draw any definitive conclusions, these investors often make the right calls in extreme situations.
When NAAIM Members Are Extremely Bullish
First, let's look at instances where the NAAIM Exposure Index exceeds 100%-meaning the average position is long with some leverage-a sign of extreme bullishness. If this index were a contrarian indicator, we would expect poor average market performance following such extreme bullishness. However, the reality is quite different. The chart and table below show the performance of the S&P 500 Index when the NAAIM Exposure Index reads above 100%.
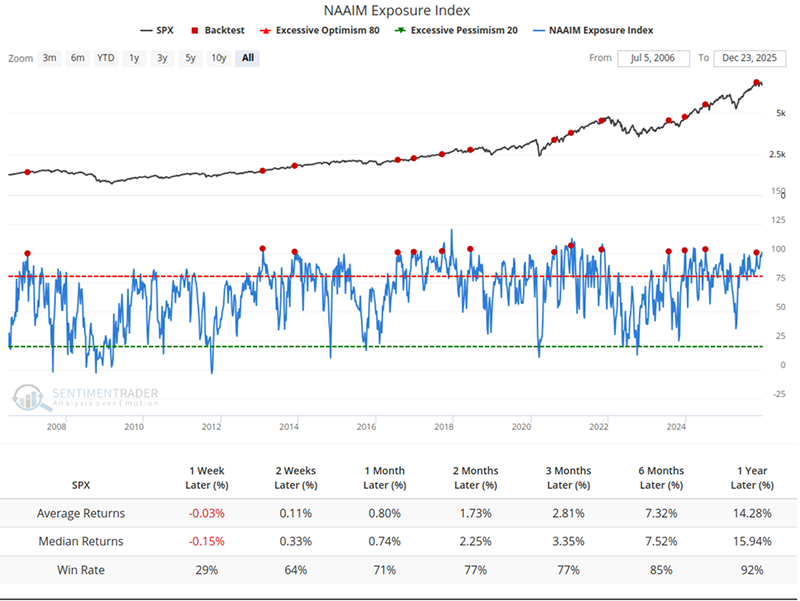
Note that the win rate exceeds 70% across time horizons from 1 month to 12 months. It is worth highlighting that this is a weekly indicator, with the latest reading of 100.7 on Last Week, which has just crossed above 100.
The performance of various sectors following this signal is as follows:
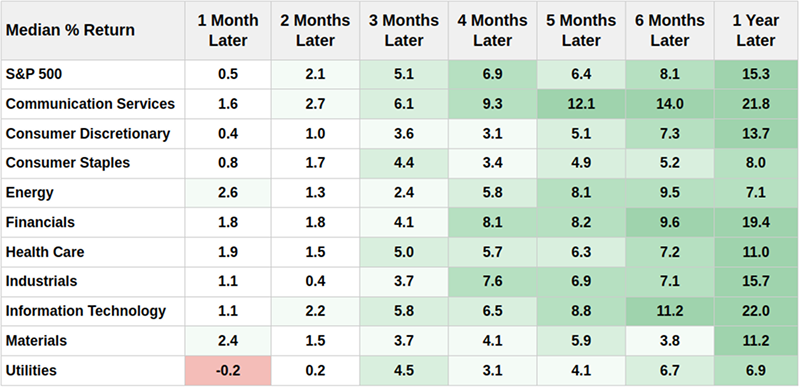
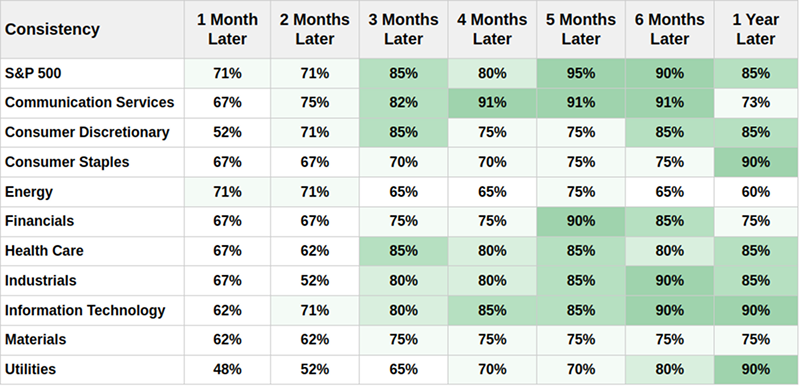
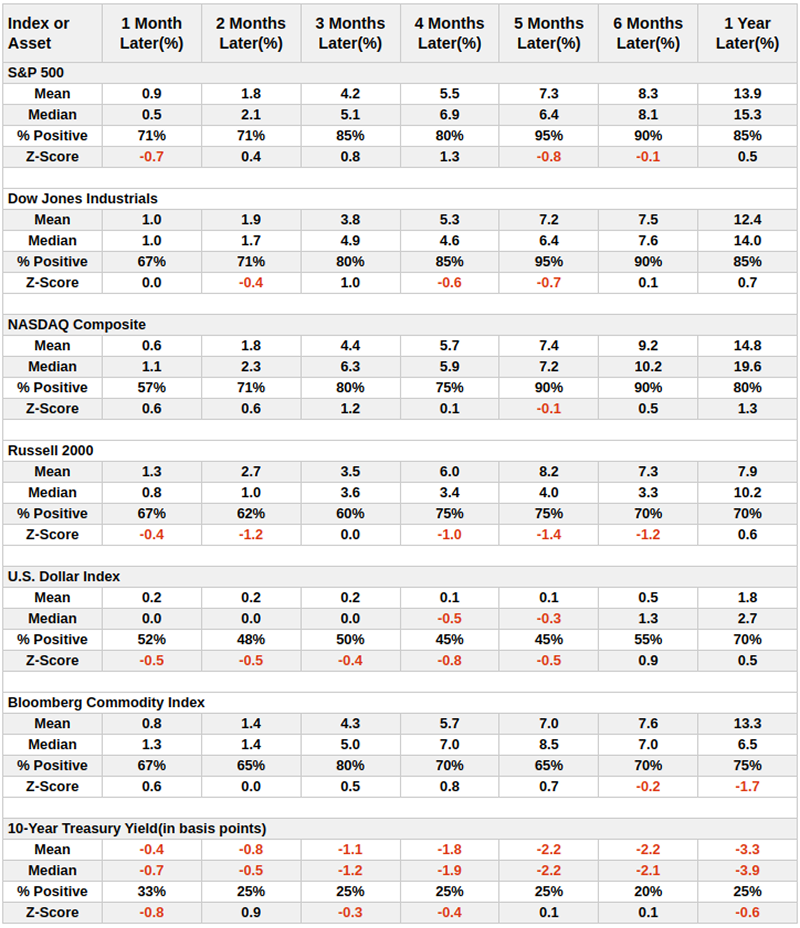
It is important to note that not all stocks benefit from this trend. The Information Technology and Communication Services sectors perform well, while the Energy sector and Russell Indices lag in comparison.
A Potentially Effective Trend-Following Approach
As we saw earlier, seasoned investors typically avoid all-or-nothing strategies (i.e., either 100% invested or 100% out of the market). Instead, many adjust their equity allocation based on perceived risk. The indicator below suggests that NAAIM members do this quite effectively. While any single weekly reading may be just "noise," smoothing the data adds more value. When markets weaken, members tend to reduce positions to lower risk. Once markets bottom out and rebound, members usually adjust quickly by increasing positions. We use the 50-week moving average of weekly readings to track this trend.
The chart and table below highlight the rare instances where the 50-week moving average of the NAAIM Exposure Index exceeds 80%.Related Backtest Click Here.
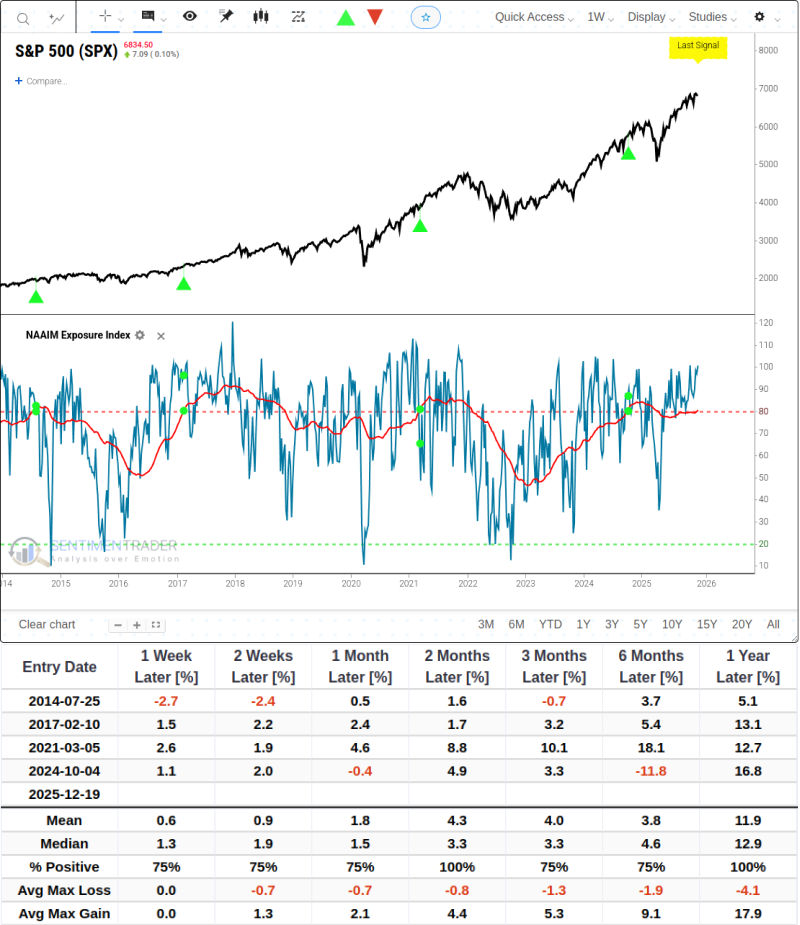
Again, the sample size is very small. But remember, we view this indicator as a "weight of evidence" rather than an automatic buy or sell signal. Historically, this indicator has served well in that capacity. Following a break above 80%, the average 12-month gain is 11.9% with a 100% win rate. Notably, a new favorable signal (50-week moving average crosses above 80%) emerged on Last Week.
Does this guarantee that the stock market will rise over the next 12 months? Of course not. But it does add weight to a bullish outlook, as it indicates that a group of professional investors who closely monitor market dynamics believe the equity environment is improving.
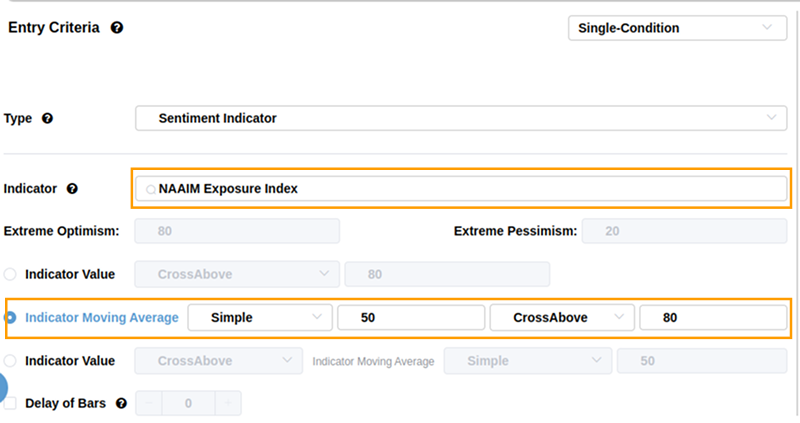
For new users who are just starting to explore our BacktestEdge, you can reproduce the above research and view more detailed data dimensions by following these steps:
- Search for NAAIM Exposure Index in the Indicator Library.
- Set the condition to 50-Week Moving Average Cross Above 80.
- Click Run.
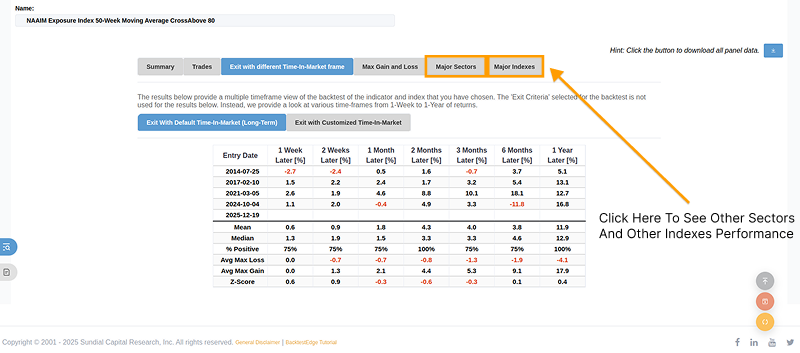
On the results page, you will be able to see detailed post-signal performance, including comparisons between different sectors (e.g., Technology vs. Energy). This will streamline your research process and avoid the need to recreate backtests from scratch.
What the Research Tells Us...
Like many indicators, the NAAIM Exposure Index is generally not suitable for use as a standalone buy or sell signal, but rather as part of a comprehensive analysis that considers multiple factors. However, paying attention to and following the lead of these investors when they take extreme positions may be beneficial. More importantly, the index appears to strongly confirm favorable trends in the overall stock market when their positioning shifts from defensive to offensive.