
Multiple Sectors Hitting New Highs Simultaneously

Key Points:
- S&P 500 hits all-time high with 3 core sectors (Tech, Comms, Consumer Discretionary).
- Historical data: long-term gains, short-term volatility.
- Aligns with rate cuts; short-term risks noted.
New High Led by the Market's Core Engines
The world's most closely watched index hit another all-time high yesterday. The key to analyzing the "quality" of a breakthrough lies in examining its internal structure.
Beyond the index itself, three crucial leading sectors-Technology (XLK), Communications (XLC), and Consumer Discretionary (XLY)-also reached historical peaks simultaneously.
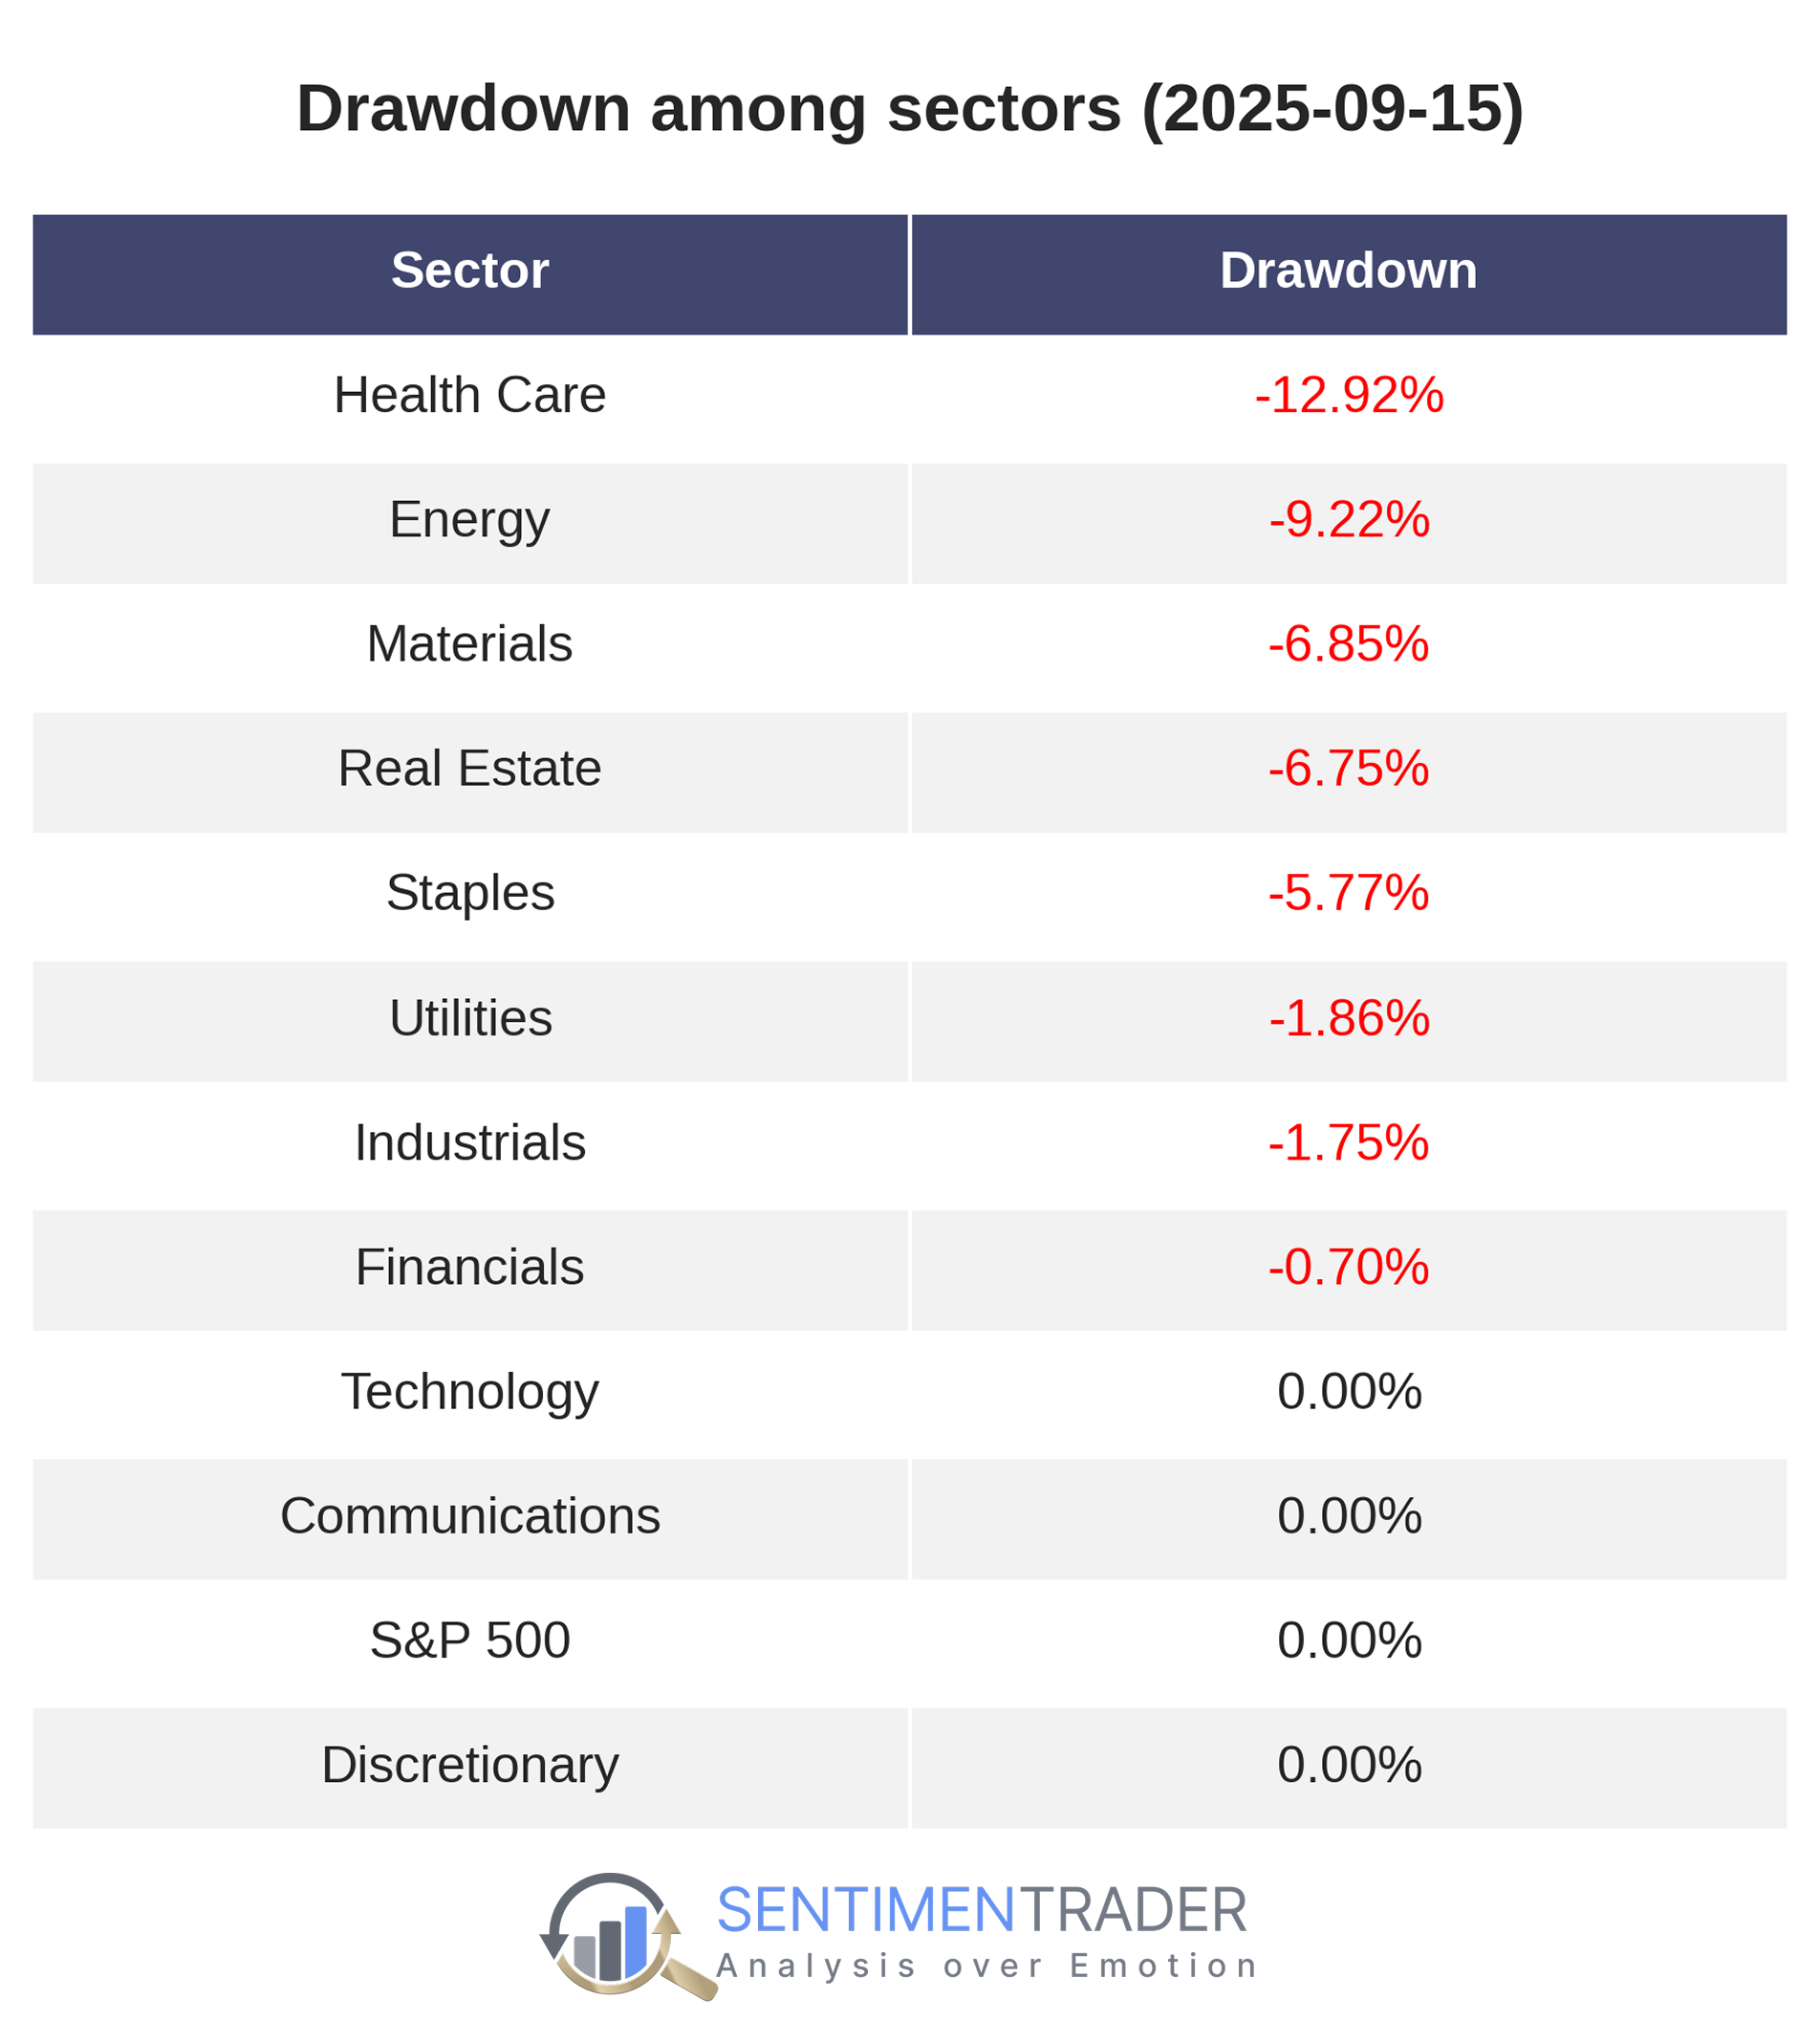
The chart below illustrates the "market fingerprint" of this breakthrough. It clearly depicts a healthy formation where growth-oriented sectors take the lead as the "vanguard," with other economically sensitive sectors (such as Financials and Industrials) following closely.
This article aims to explore, through historical data backtesting, the patterns and characteristics of subsequent performance of market breakthroughs with such internal structures.
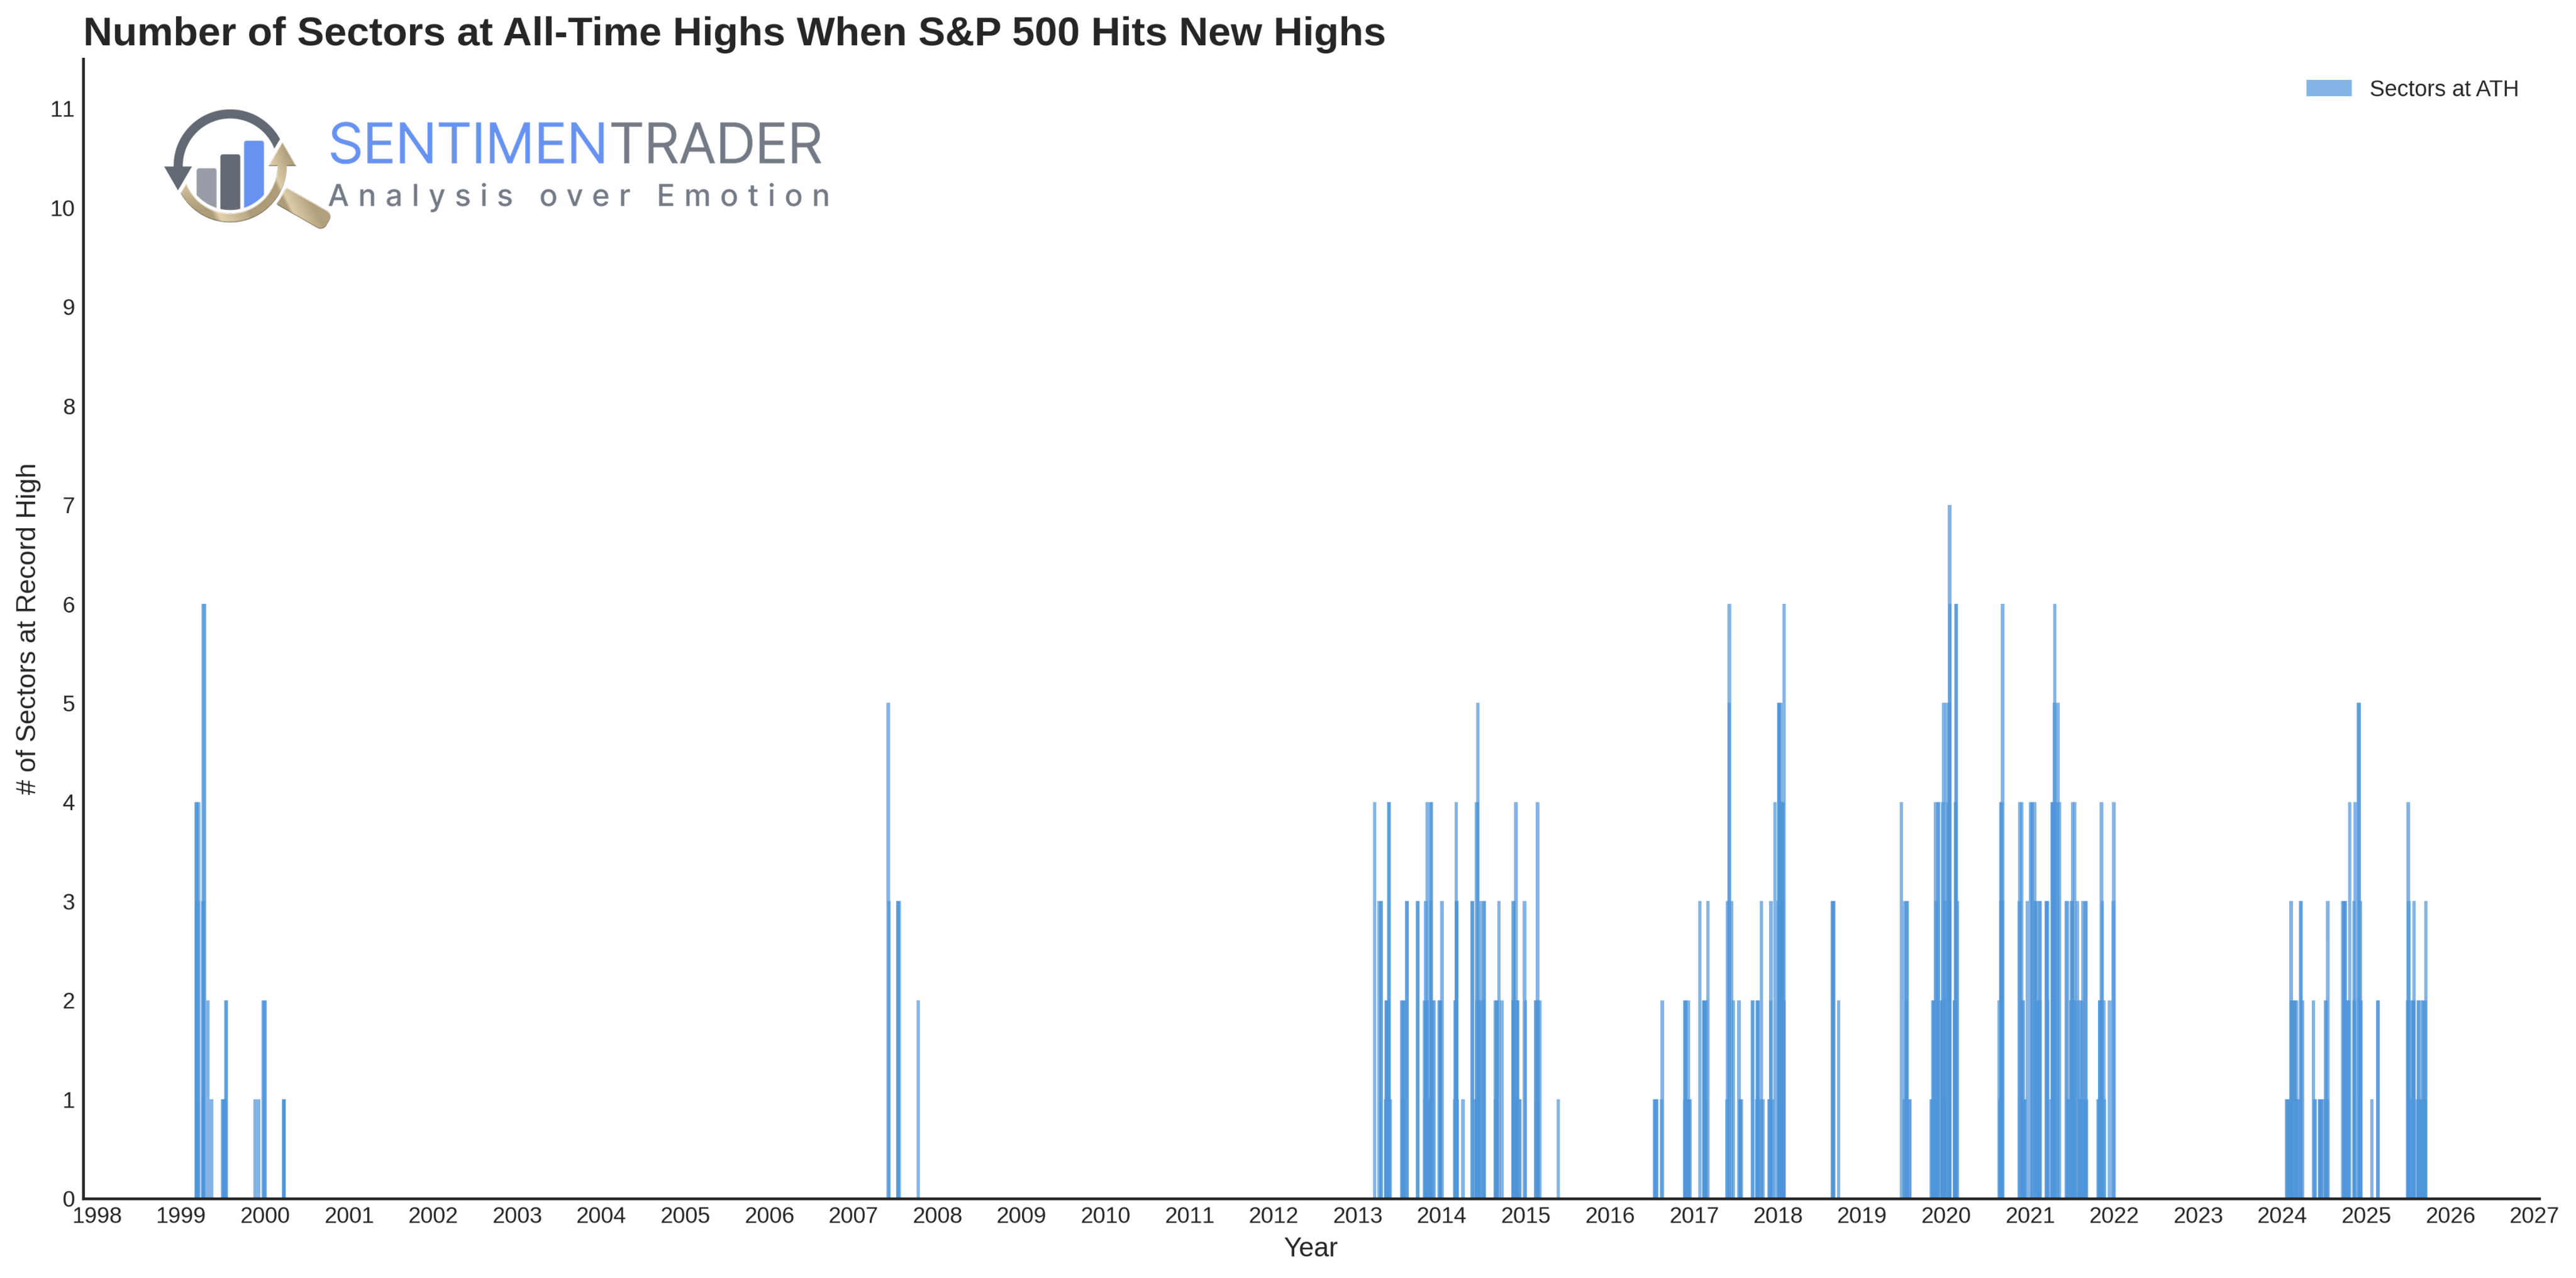
The chart below shows how many sectors follow suit when the S&P 500 Index hits a new high. The historical distribution reveals a "quality spectrum" of breakthroughs: in most cases, only zero, one, or two sectors hit new highs simultaneously, indicating that many breakthroughs have relatively narrow foundations.
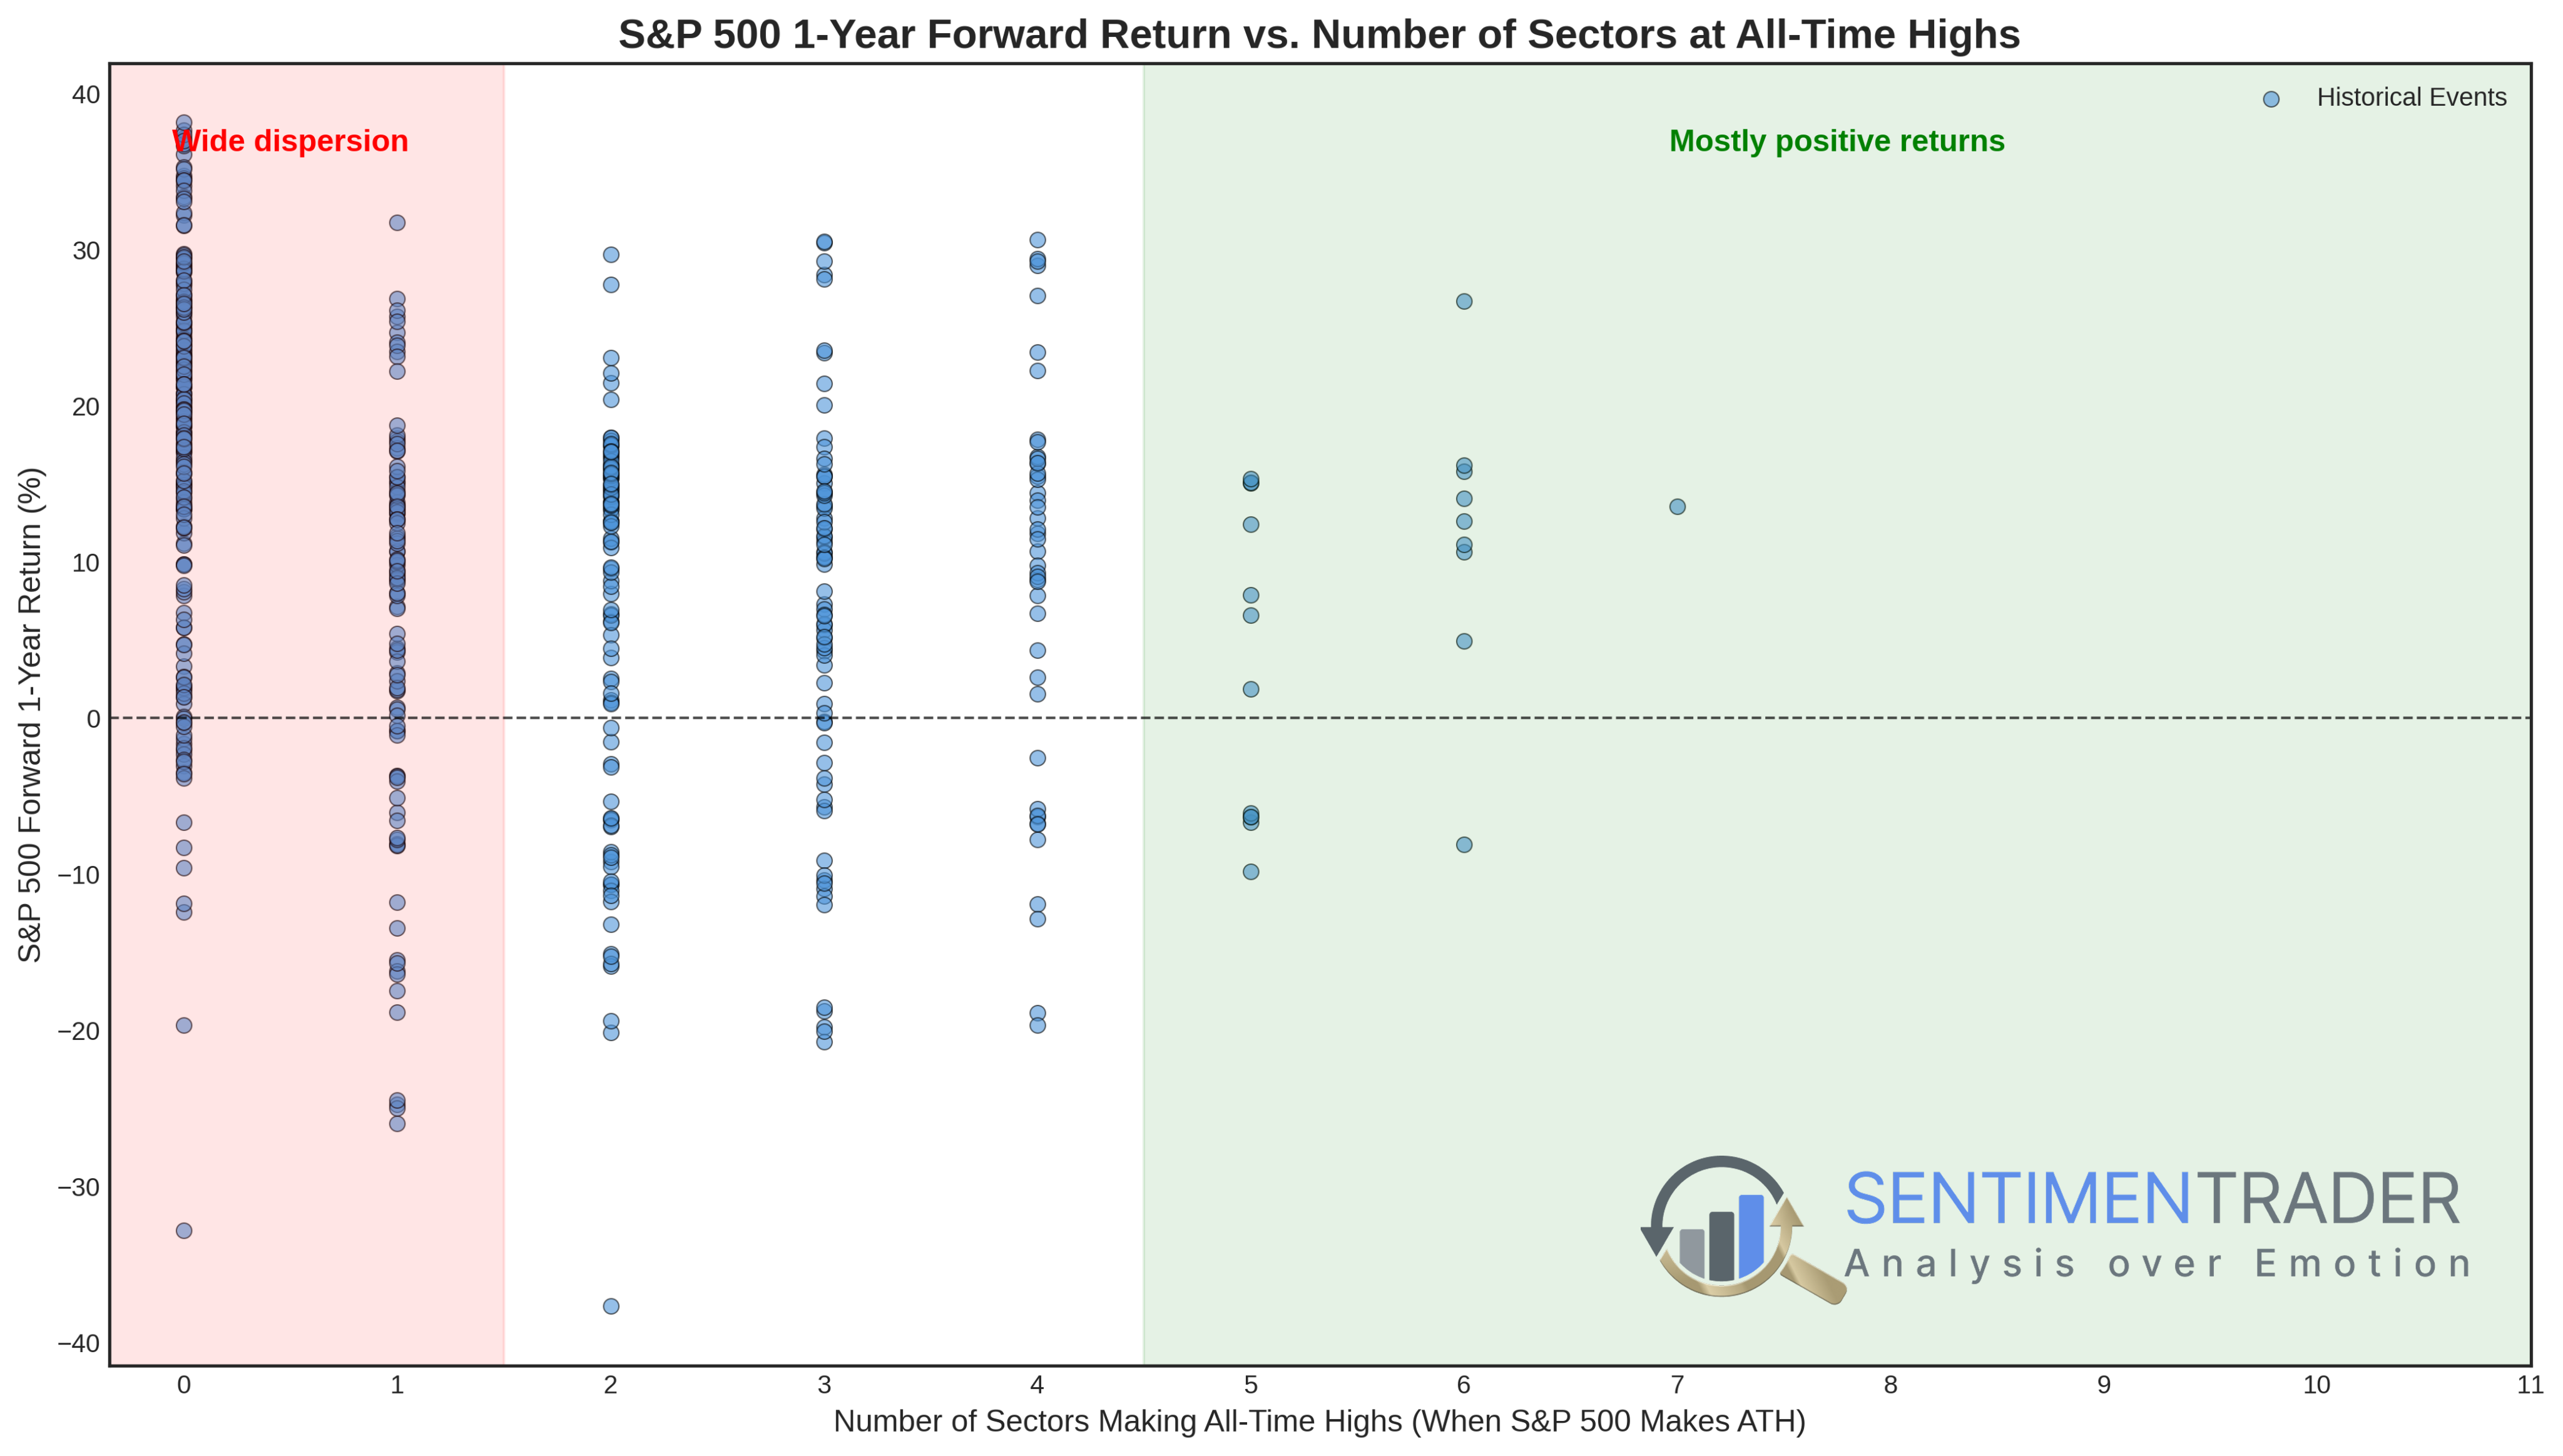
The scatter plot below shows that when only a few sectors (0-2) participate in the breakthrough, the one-year forward return distribution is highly dispersed, including cases of substantial losses.
However, as the number of participating sectors increases, the distribution of forward returns tends to concentrate in the positive range, with reduced dispersion.
Yesterday, three sectors hit new highs alongside the index, representing a significant upgrade in market participation-a typical feature of historically healthy, broad-based bull market rallies.
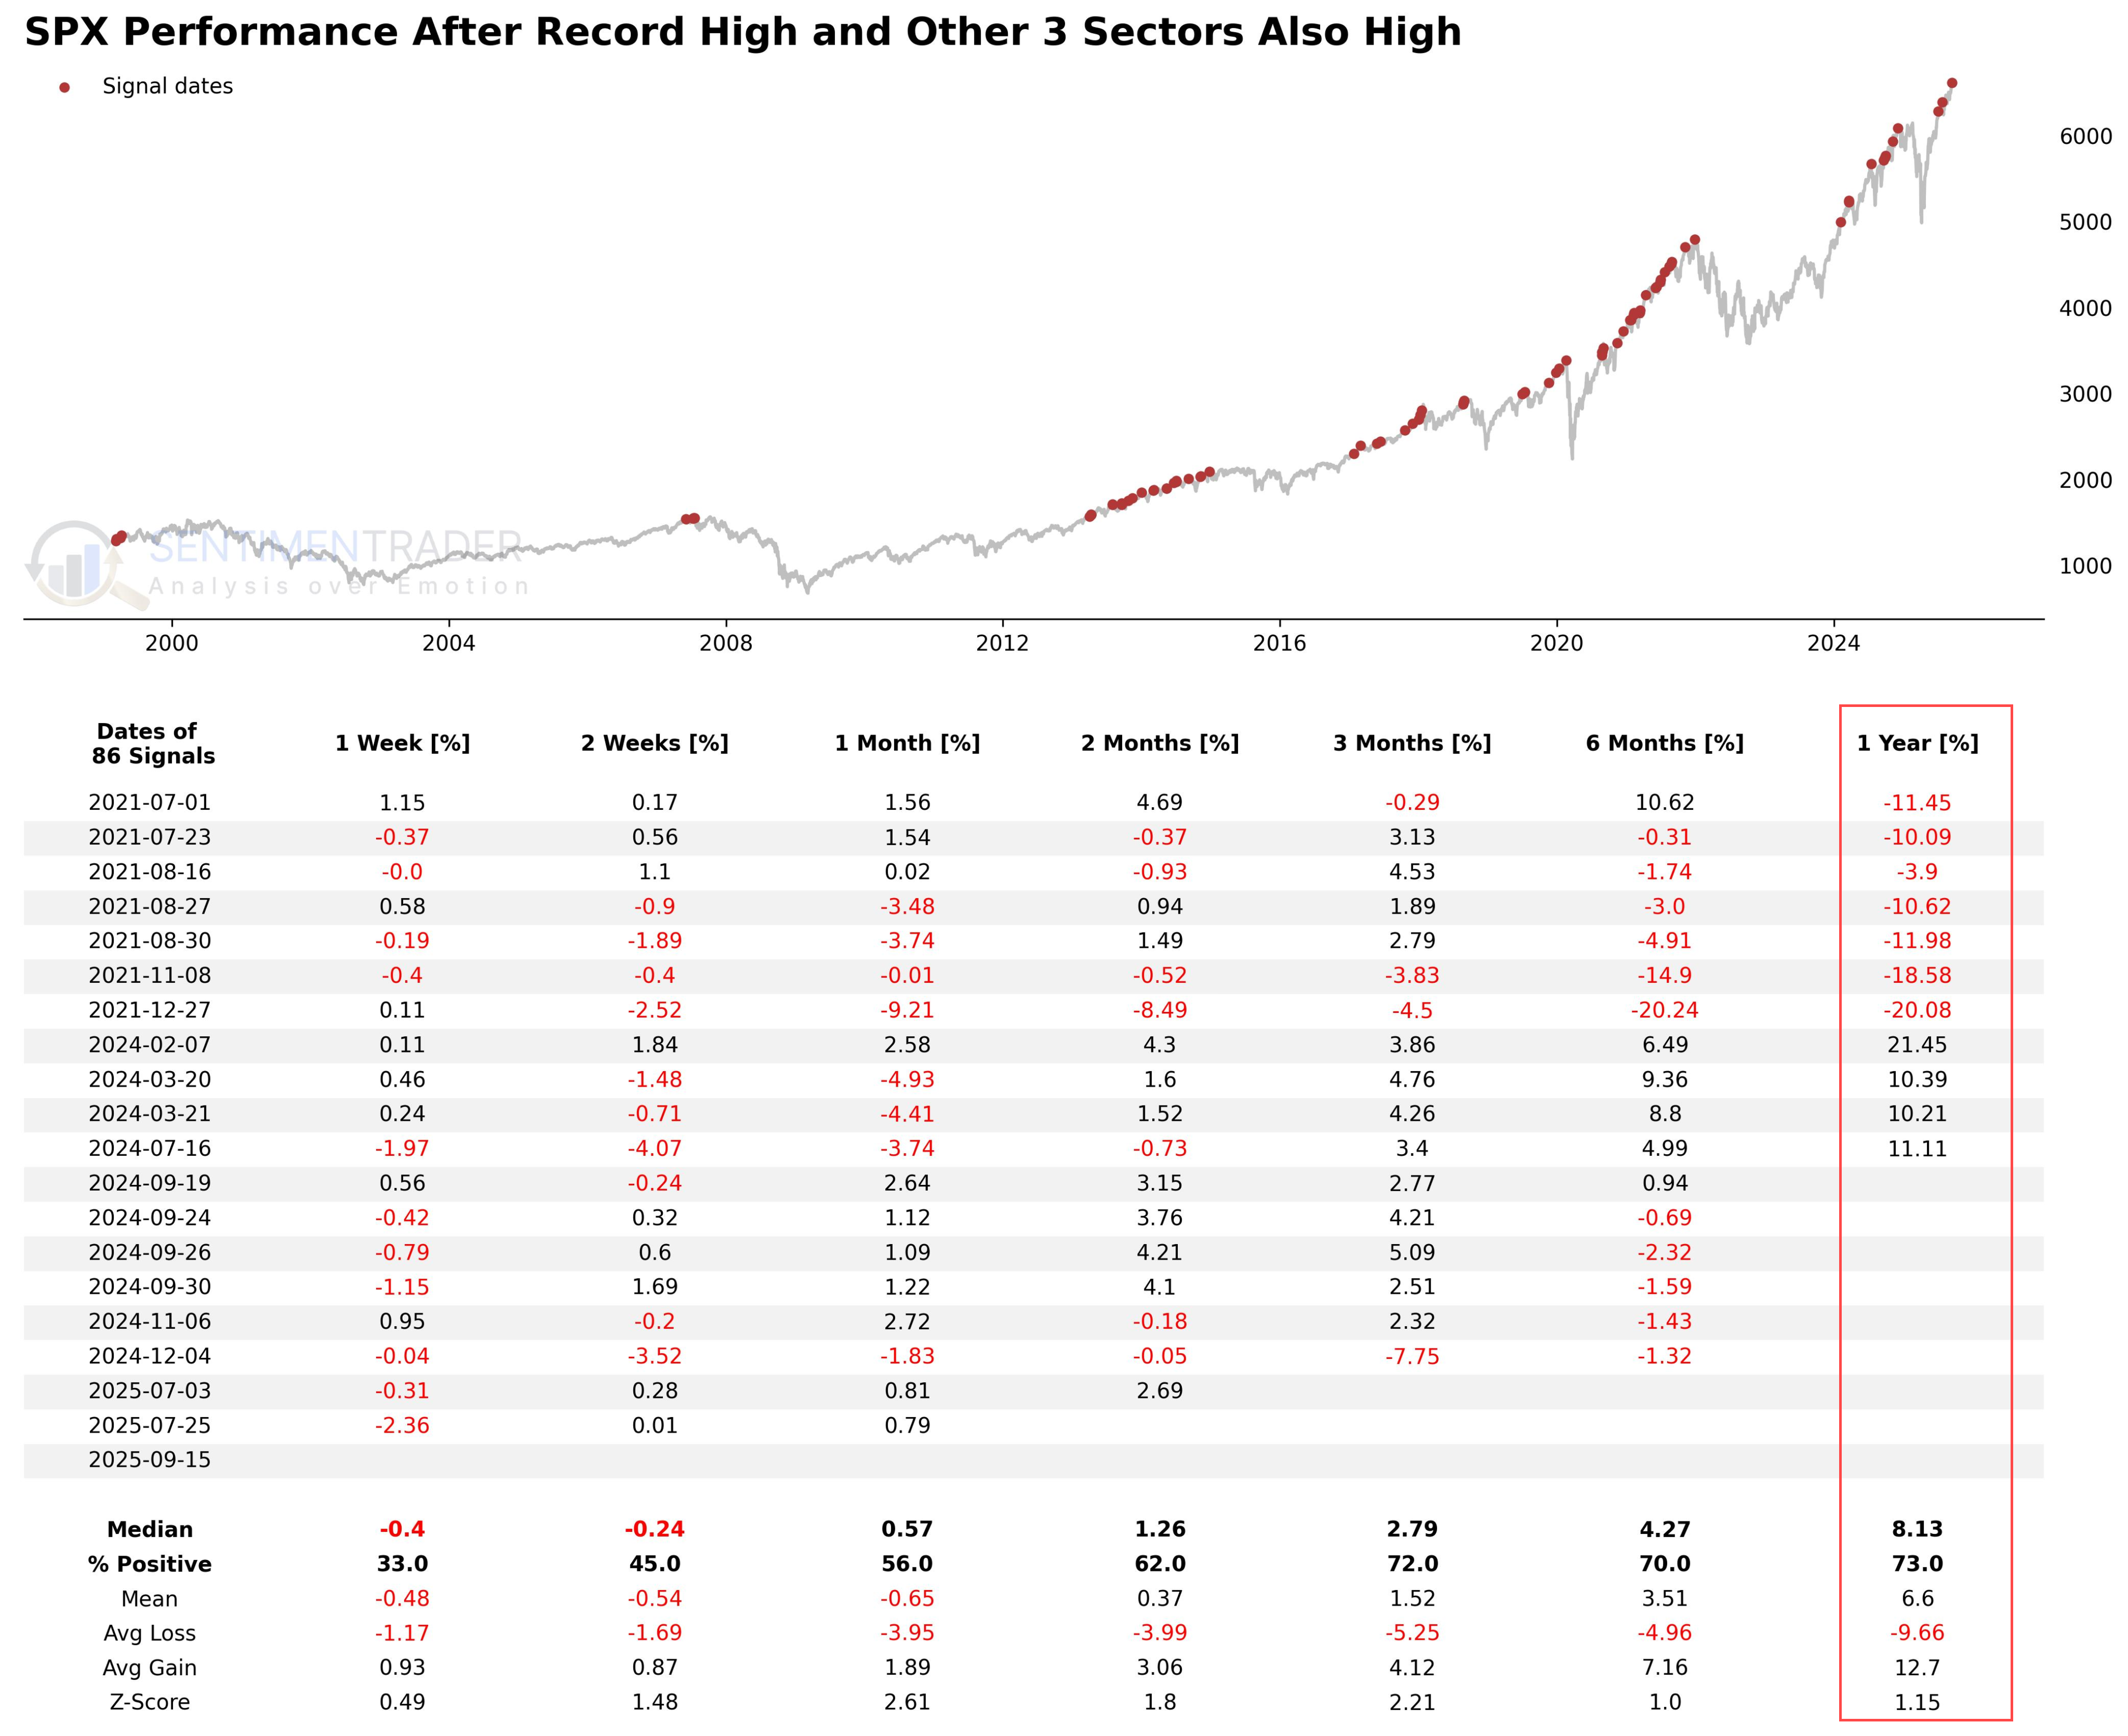
The table below summarizes the historical performance of the "Four High Club" (i.e., the S&P 500 and any three sectors hitting new highs simultaneously).
Based on a relatively sufficient sample of 86 signals, the data shows that the win rate of such signals one year later is 73%, with a median return of +8.13%, demonstrating a certain degree of robustness as a long-term trend indicator.
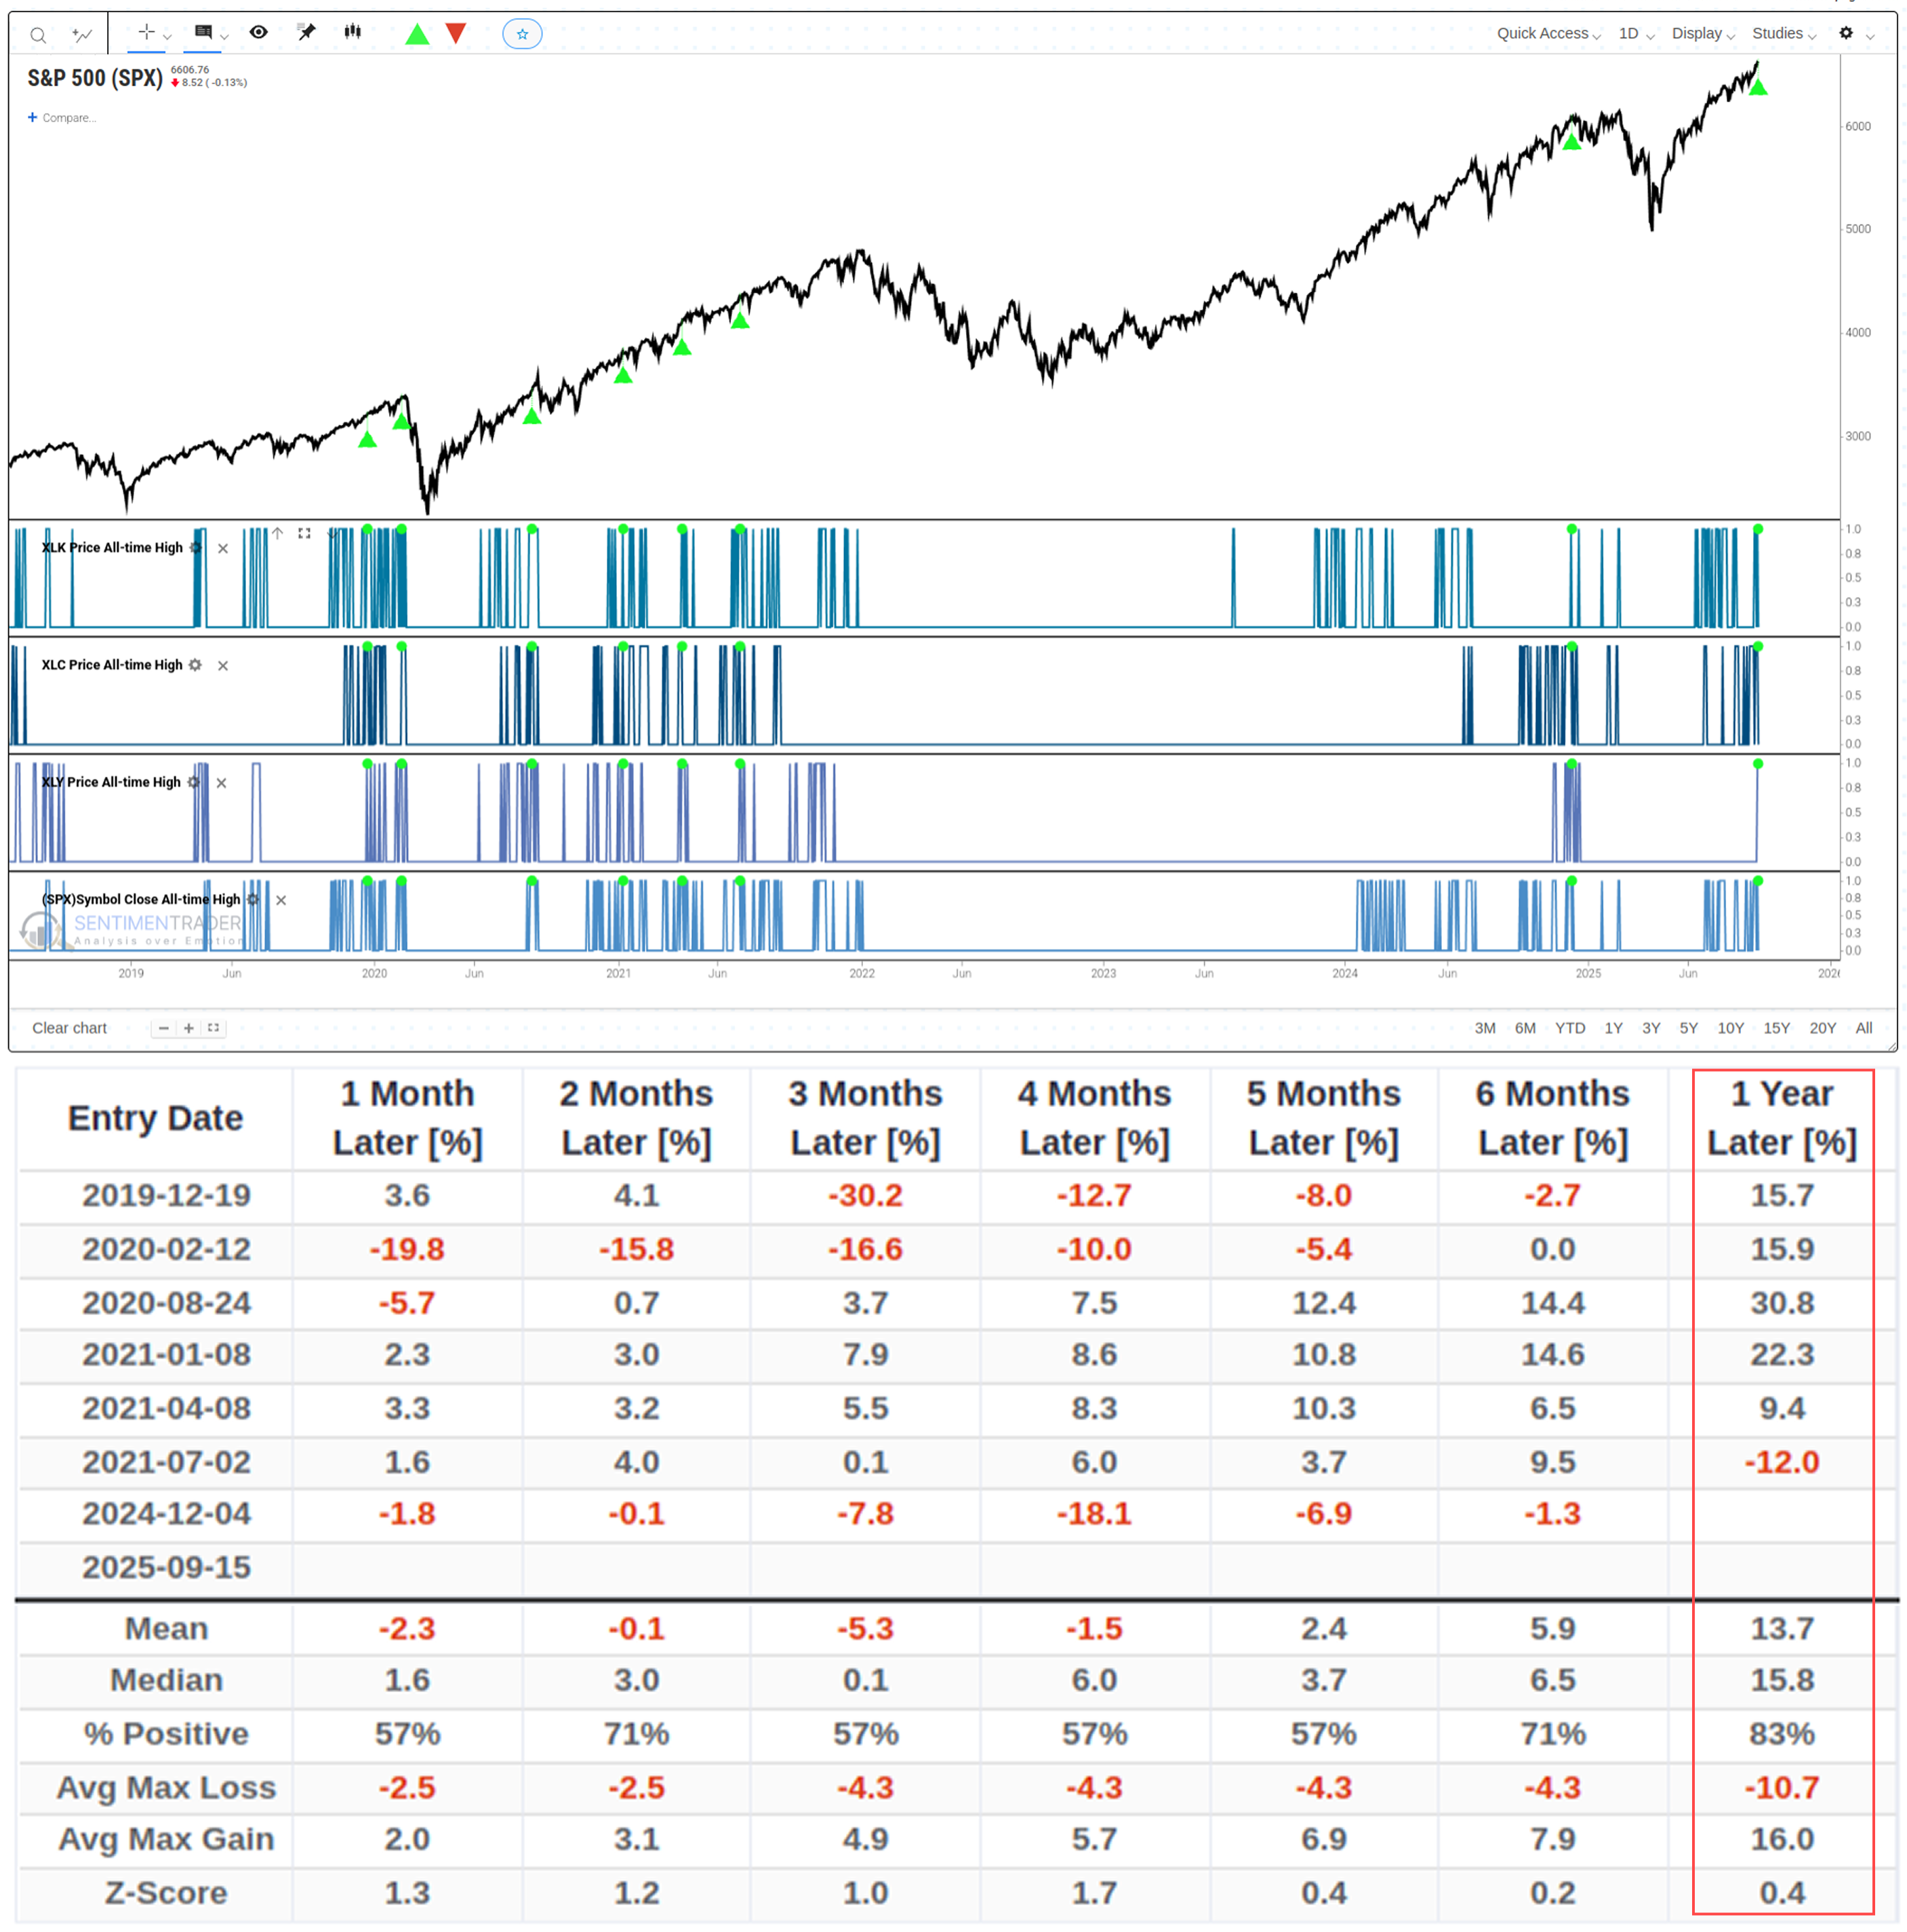
The current signal is led by the Technology, Communications, and Consumer Discretionary sectors. To obtain a more relevant comparison, the table below isolates breakthroughs led by the exact same "leading pioneers" as yesterday.
It must be emphasized that the historical sample size for this specific combination is only 7 cases-far too small to ensure the reliability of its statistical results.
In this extremely small sample, we have observed a preliminary "short-term volatility, long-term strength" pattern. Its median return one year later is +15.8%, with a win rate of 83%.
It must be reiterated that based on such a small number of cases, this observation should not be regarded as a validated rule, but merely a phenomenon that requires more future data for verification. Related Backtest Click Here.
Re-examining Participation Breadth
From another relevant perspective-individual stock participation breadth-we can obtain some supplementary evidence. 2025-09-16, 63.53% of S&P 500 components traded above their 200-day moving average.
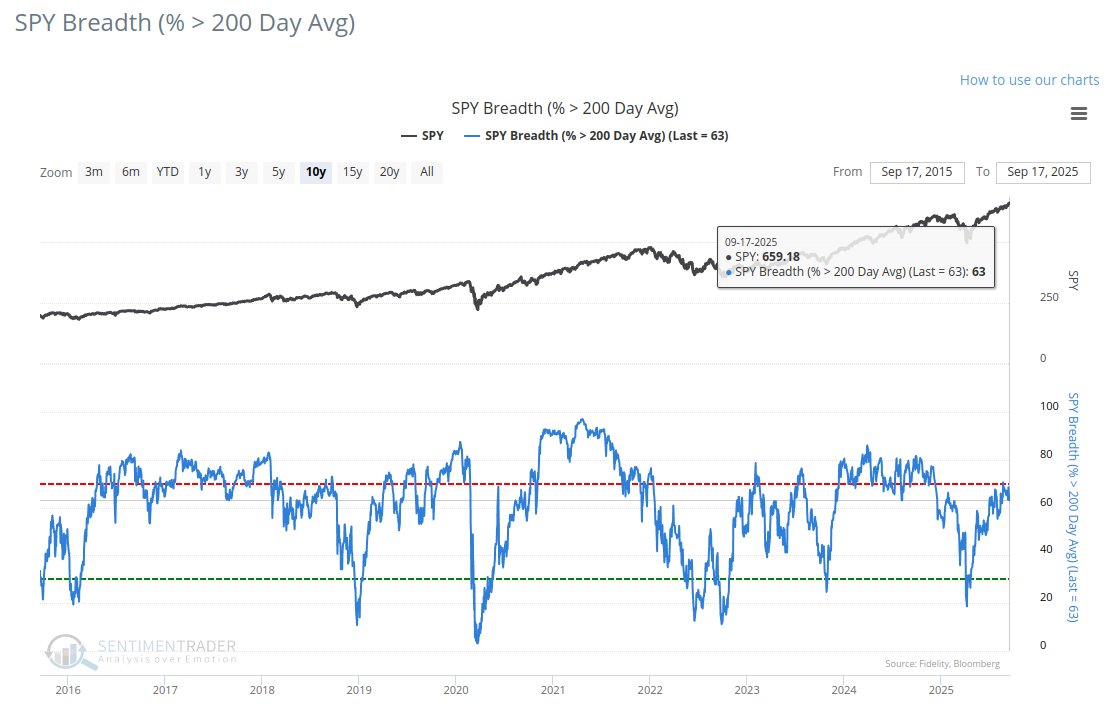
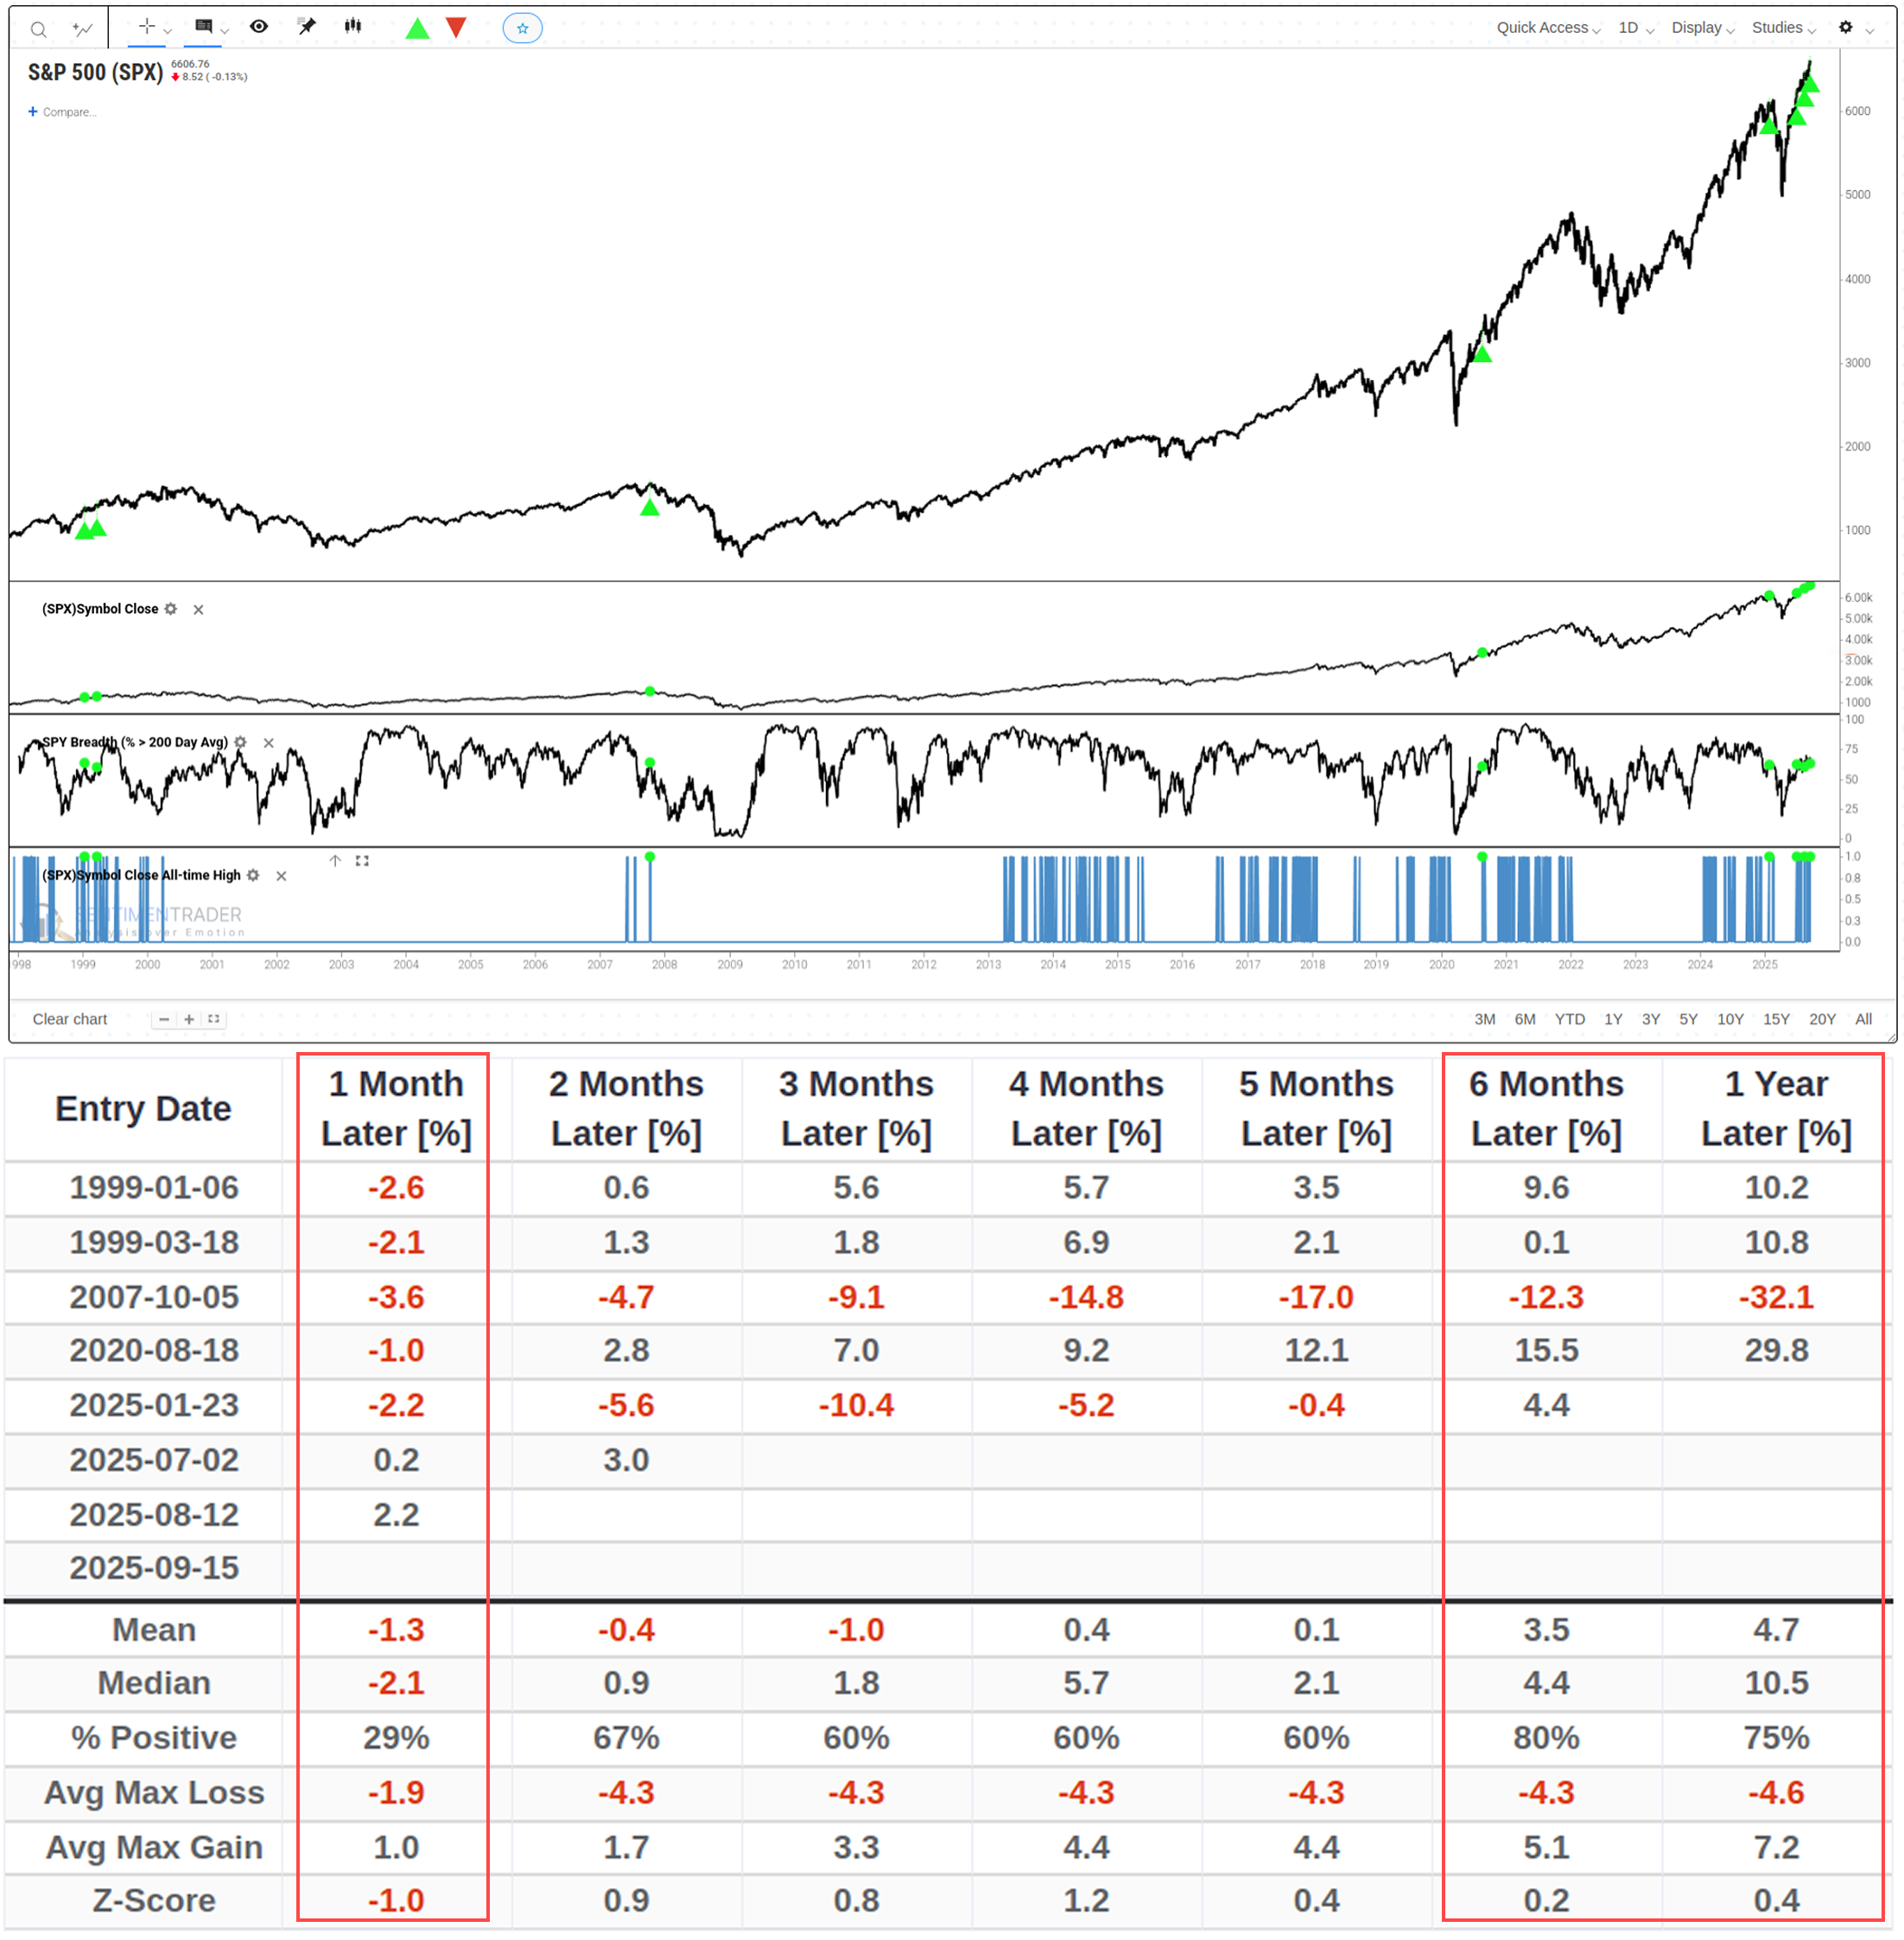
To evaluate this level, the table below shows the historical performance of all instances where the S&P 500 hit a new high while stock breadth fell within the precise 60%-65% range.
This backtest, also based on a limited sample, once again presents a similar pattern: weak short-term performance and improved medium-to-long-term performance.
The dataset includes the market top signal from October 2007, which recorded a loss of over -30% one year later. This is a clear reminder that any historical pattern may fail amid major macroeconomic regime shifts.Related Backtest Click Here.
Performance Following Interest Rate Cut Announcements
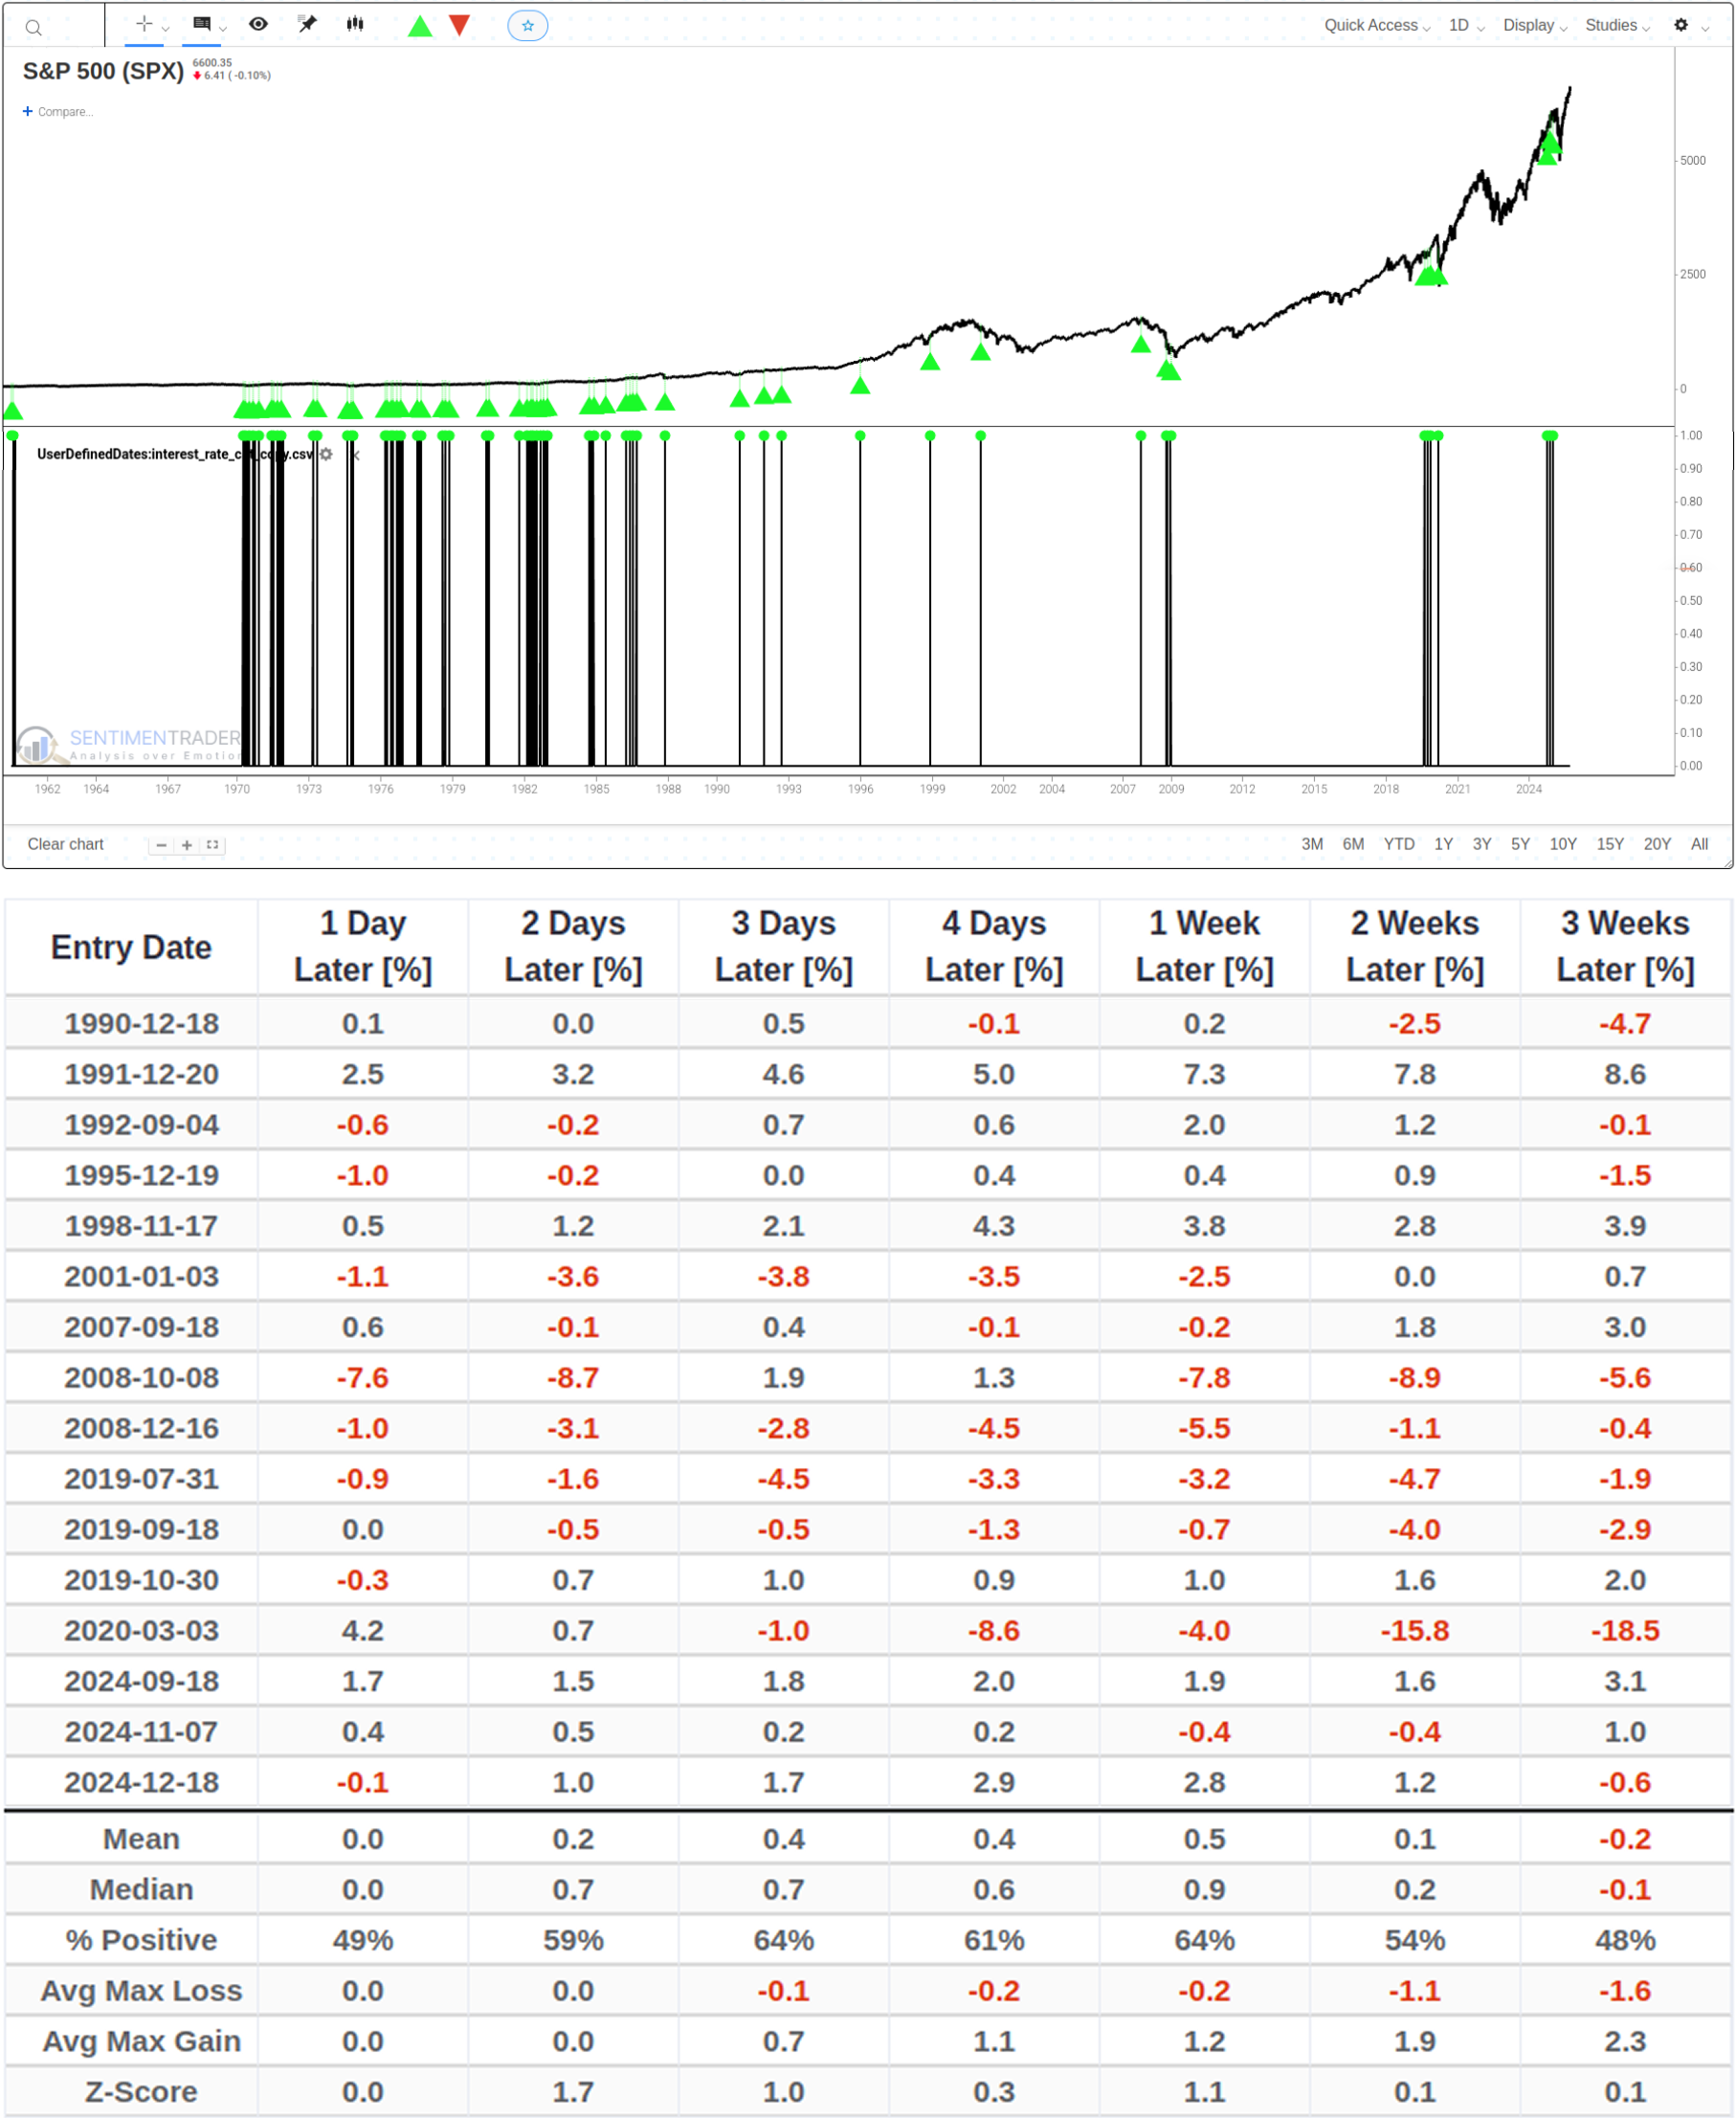
To supplement the earlier market technical structure analysis, we introduce backtest data on market performance in historical rate cut cycles for macro reference.
Data shows that after the first rate cut announcement, the S&P 500 usually consolidates short-term before seeing significantly better medium-to-long-term returns; one year later, its historical median return and win rate are both high.
This "short-term volatility, long-term strength" pattern aligns with prior conclusions from market breadth and sector rotation analysis.
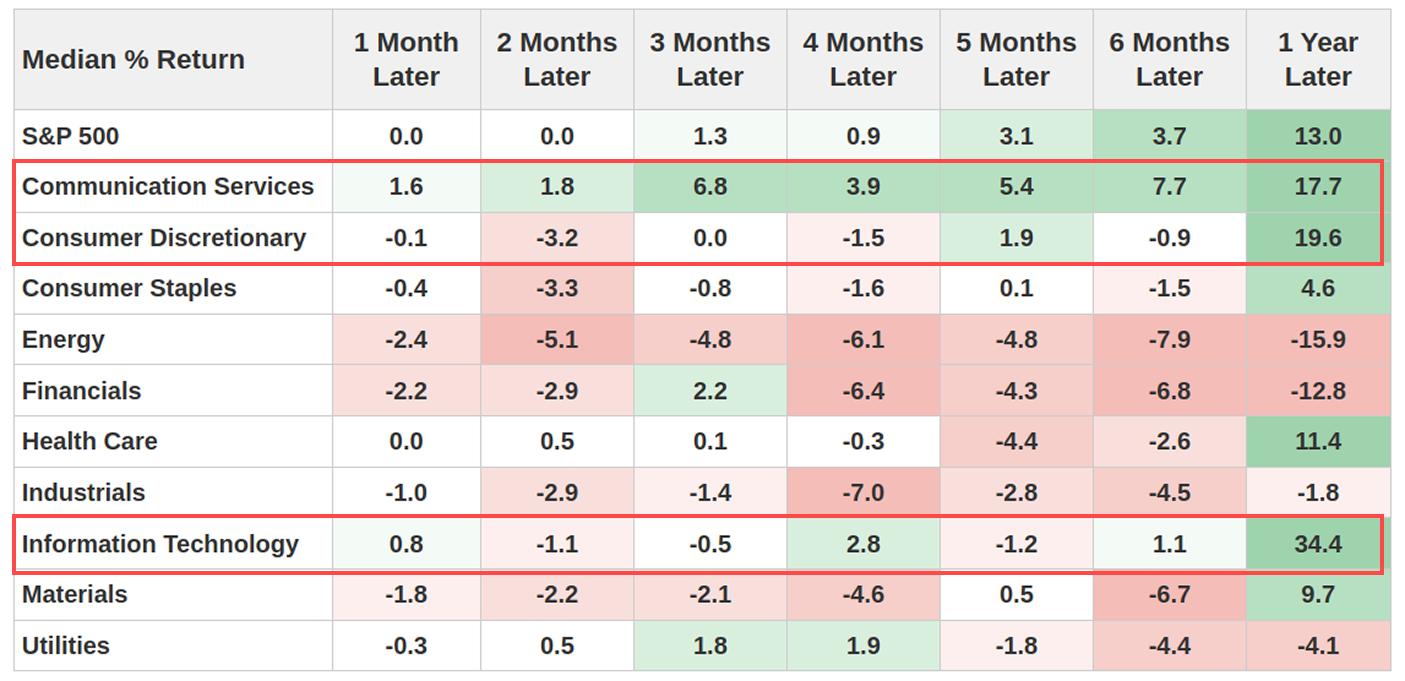
Notably, sector performance divergence sharpens in such macro conditions. Historical data reveals that growth sectors-Information Technology, Communication Services, and Consumer Discretionary-typically outperform most within a year post-rate cuts. Coincidentally, these three sectors have been the core drivers of the current market rally to new highs.
This consistency between the current technical breakout and historical market preferences in accommodative monetary environments provides fundamental support for the sustainability of current market leaders.
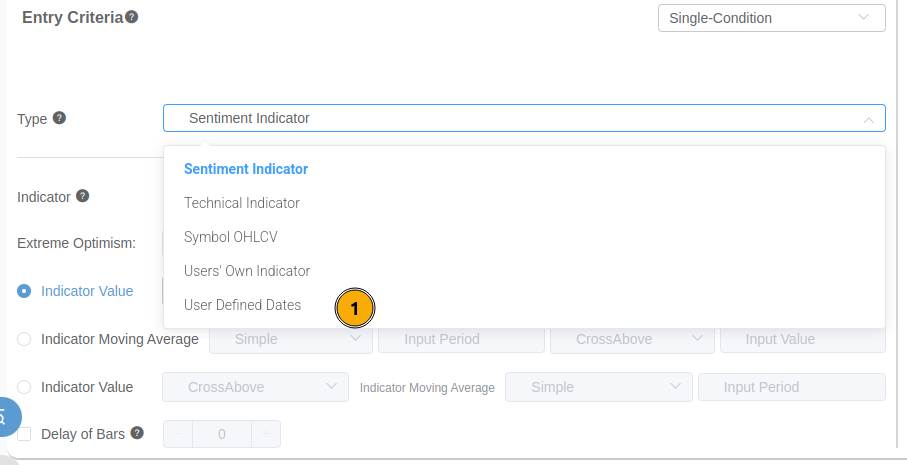
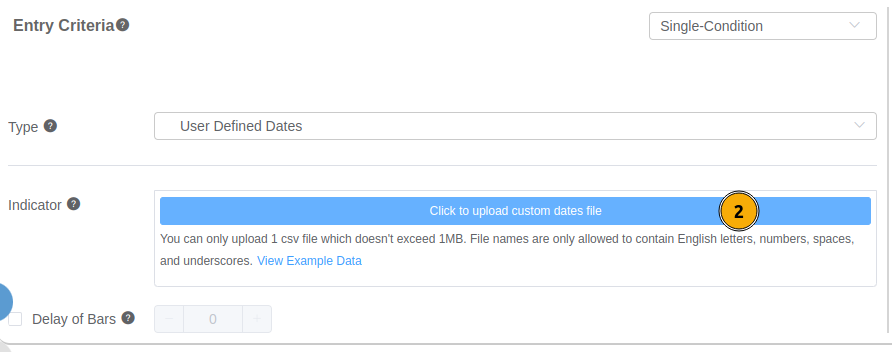
How to Create Backtest When Interest rate cut announcement
Step 1: Download this interest rate cut date CSV file.
Step 2: Follow the steps shown in the image to upload the CSV file you just downloaded, and you can proceed with backtesting.
What the Research Tells Us...
Our analysis uses historical data to find patterns in scenarios similar to the current market structure. Data shows breakthroughs confirmed by multiple core sectors (with moderately healthy stock breadth) have historically tended to bring long-term positive returns.Most targeted backtests have tiny samples (limited statistical value); only historical correlations (not causality) are shown; macro environments change, so past patterns may not repeat.
Observations link yesterday's breakthrough to a historical "first decline, then rise" trajectory. Yet data also flags a major risk: short-term (1-3 month) weakness and uncertainty.This new high is not a signal to rashly chase gains. The conclusion is not a "market will rise" prediction, but that the current structure is historically tied to high volatility. While long-term investors can be cautiously optimistic, short-term risks are clear-potential short-term volatility must be a core risk factor for any investment decision.