
Most industries are hovering near six-month relative lows

Key points:
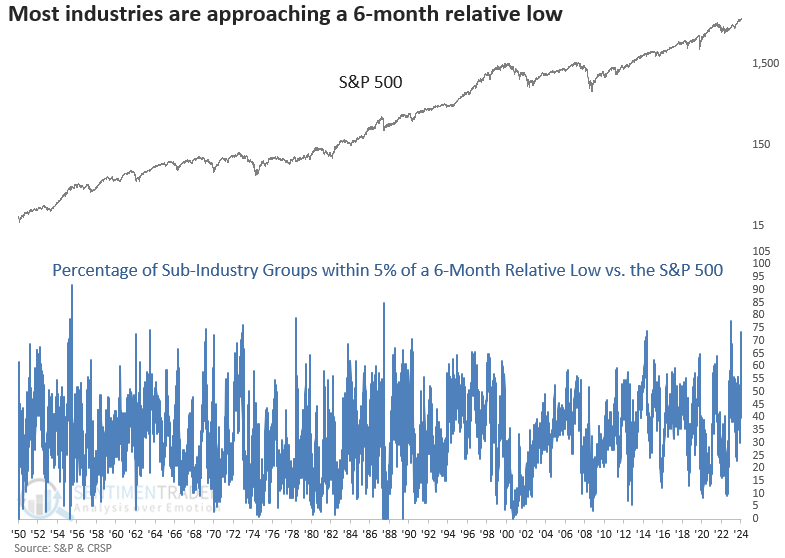
- Over 73% of sub-industry groups closed within 5% of a 6-month relative low
- Similar relative trend conditions suggest the S&P 500 could struggle over the next month
- The S&P 500 underperformed the S&P 500 Equal-Weighted index from one to twelve months later
Stocks across all market capitalizations are struggling to keep up with the S&P 500
On Monday, I published a research note highlighting the narrow-sector leadership among S&P 500 sectors. The report showed that only Technology and Communication Services exhibited a positive relative trend score compared to the S&P 500.
Much like S&P 500 sectors, S&P 1500 sub-industry groups are demonstrating unfavorable relative trend profiles against the world's most benchmarked index, with fewer and fewer groups managing to keep up with the cap-weighted index.
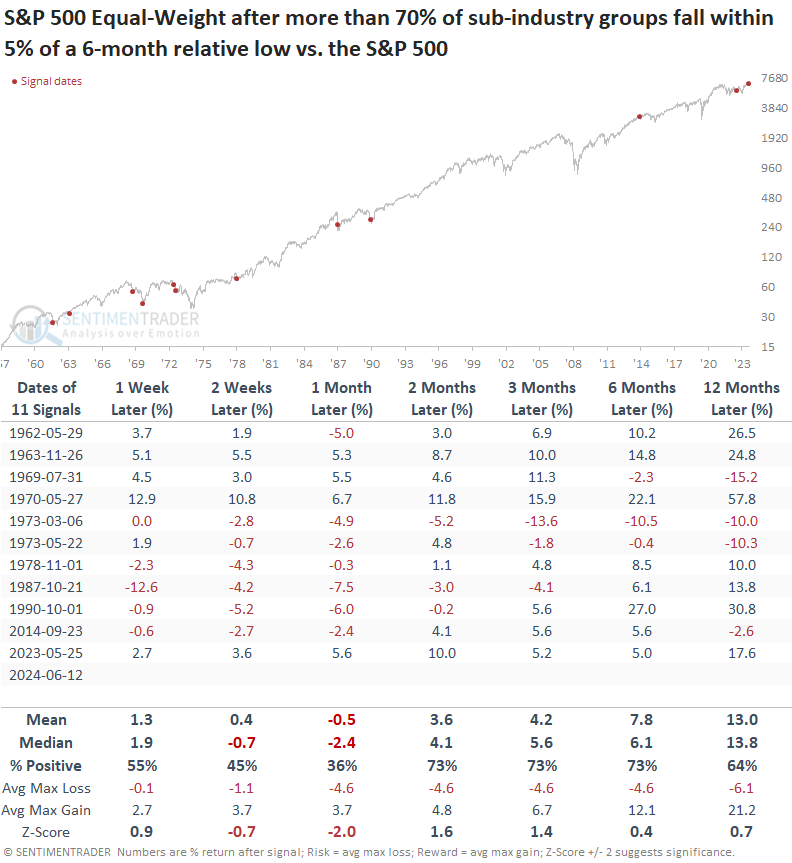
On Thursday, 73% of sub-industry groups closed within 5% of a 6-month relative low versus the S&P 500, marking only the third occurrence since 1990.
Providing additional evidence regarding the narrowing in leadership, on Thursday, the percentage of S&P 500 stocks outperforming the S&P 500 index over a rolling 21-day period fell to the second-lowest point in history, at 18%.
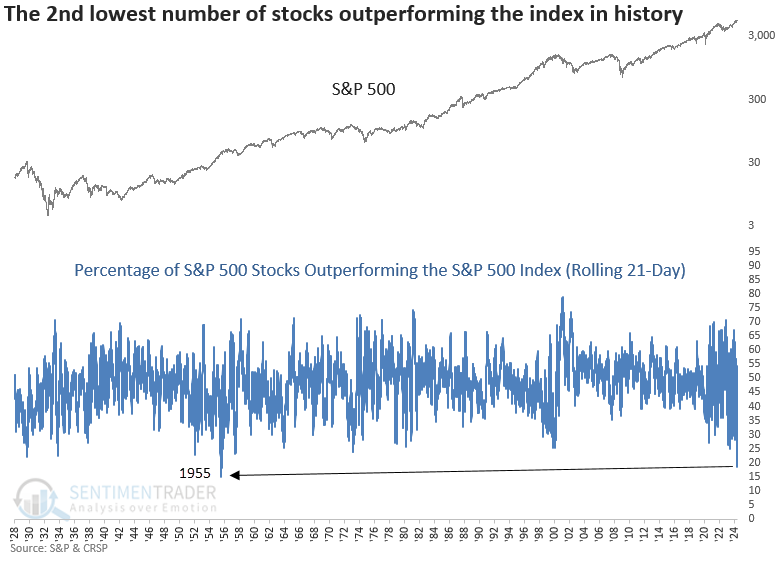
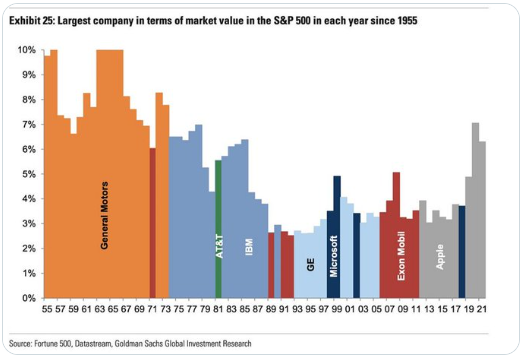
Interestingly, the record low reading in the percentage of S&P 500 stocks outperforming the S&P 500 index over a rolling 21-day period occurred in 1955, when one stock, General Motors, accounted for 10% of the weighting in the S&P 500.
As we've emphasized multiple times over the last month, breadth and relative performance indicators are diverging from the cap-weighted S&P 500, largely due to the significant influence of a small number of heavily weighted stocks.
Similar relative trends suggest stocks could struggle in the near term
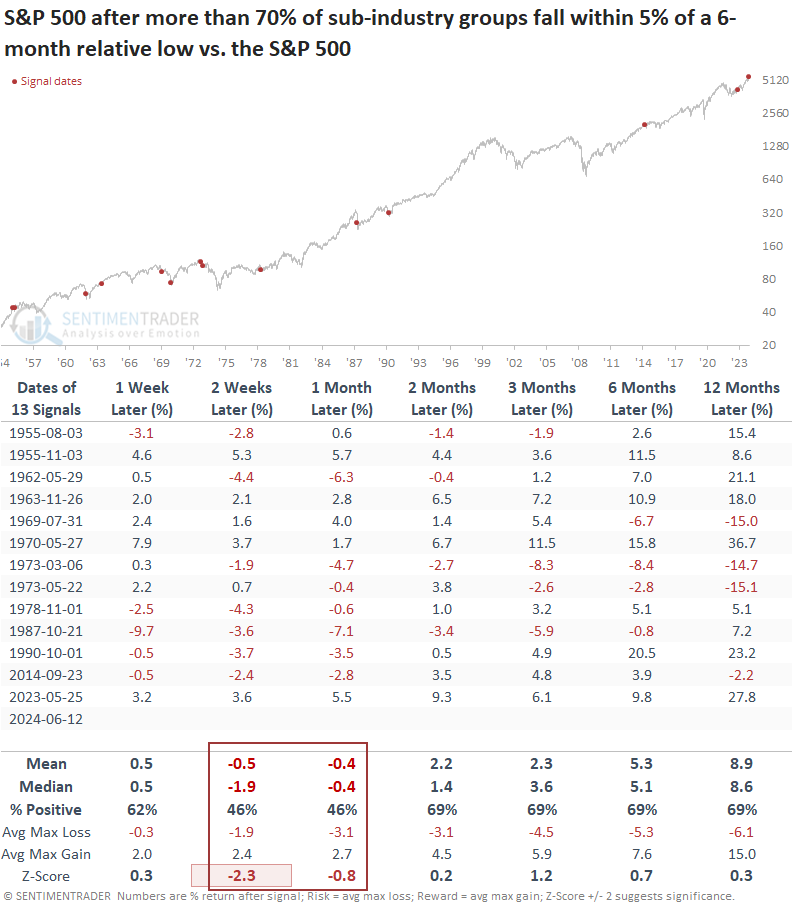
Whenever more than 70% of S&P 1500 sub-industry groups fall within 5% of a 6-month relative low against the S&P 500, the world's most benchmarked index tended to struggle over the subsequent month. From a long-term perspective, returns and win rates were okay.
The S&P 500 experienced a significant rally following the previous instance in May 2023, but at that time, it had been consolidating for almost six weeks, which contrasts with the current situation.
Interestingly, not a single instance occurred in the late 1990s when leadership narrowed. However, concentration was more broad-based within Technology, whereas today, it's a handful of mega-cap stocks.
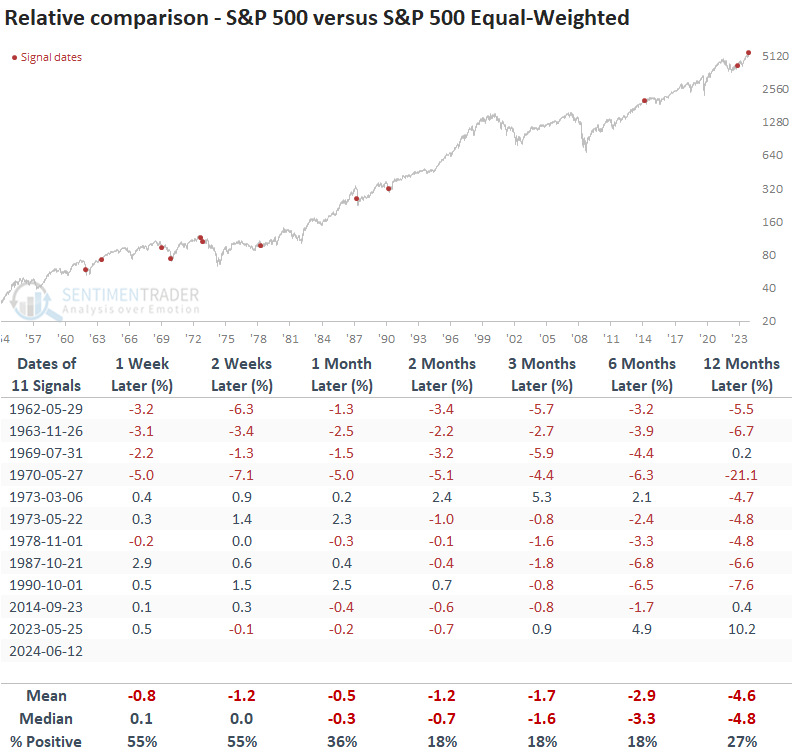
The S&P 500 Equal-Weighted Index shows a similar trajectory, pointing to possible near-term challenges before an advantageous period.
Due to data limitations, this outlook table contains two fewer signal dates.
From one to twelve months later, the S&P 500 Equal-Weighted Index outperformed the S&P 500. Given investors' mindsets regarding artificial intelligence, I'm guessing it will likely take a systemic event to see a prolonged rotation back to the average stock.
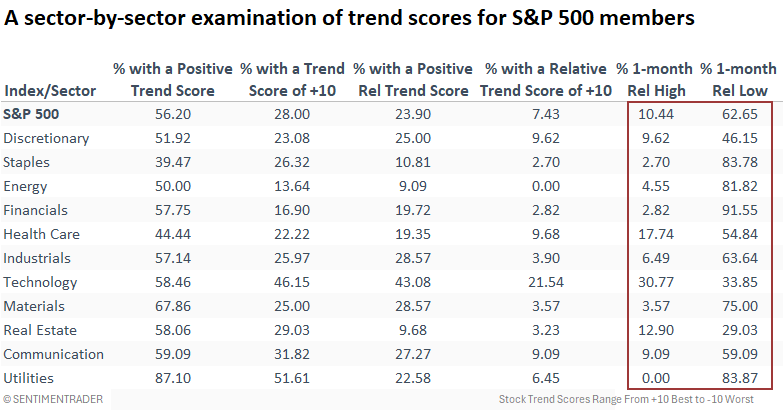
Relative lows are outpacing relative highs
The percentage of S&P 500 stocks hitting one-month lows over the past five sessions further highlights the unusual environment where mega-cap concentration significantly impacts breadth and relative trend indicators. This trend is evident across every sector, including Technology, where more stocks register relative lows than highs.
An update regarding the Risk-Off Composite Model signal
My Risk-Off Composite Model triggered a warning on 2024-05-30. While the S&P 500 has rallied to new highs, as it did with the previous alert from December 2021, the S&P 500 Equal-Weighted ETF (RSP) shows a negative return when measured from the open on 2024-05-31 to the current price today.
So, the average stock has struggled.
What the research tells us...
The concentration of market leadership in a dwindling number of stocks has undeniably created a more challenging market environment. The latest indicator to highlight this unique backdrop is the percentage of S&P 1500 sub-industry groups within 5% of a 6-month relative low, which has risen to 73%. Similar periods when industries exhibited weak relative trends versus the S&P 500 suggest the world's most benchmarked index could go through a short-term corrective phase within a long-term uptrend.