
Most indices are wildly above their exponential trends

Key points:
- The S&P 500, Dow Industrials, and Nasdaq Composite are all far above their long-term exponential growth rates
- The small-cap Russell 2000 is only now matching its trend, while value stocks remain far below
- While comparing current prices to exponential growth rates has weaknesses, it shows the danger in extrapolating good times
Major indices are far above trend...except for one
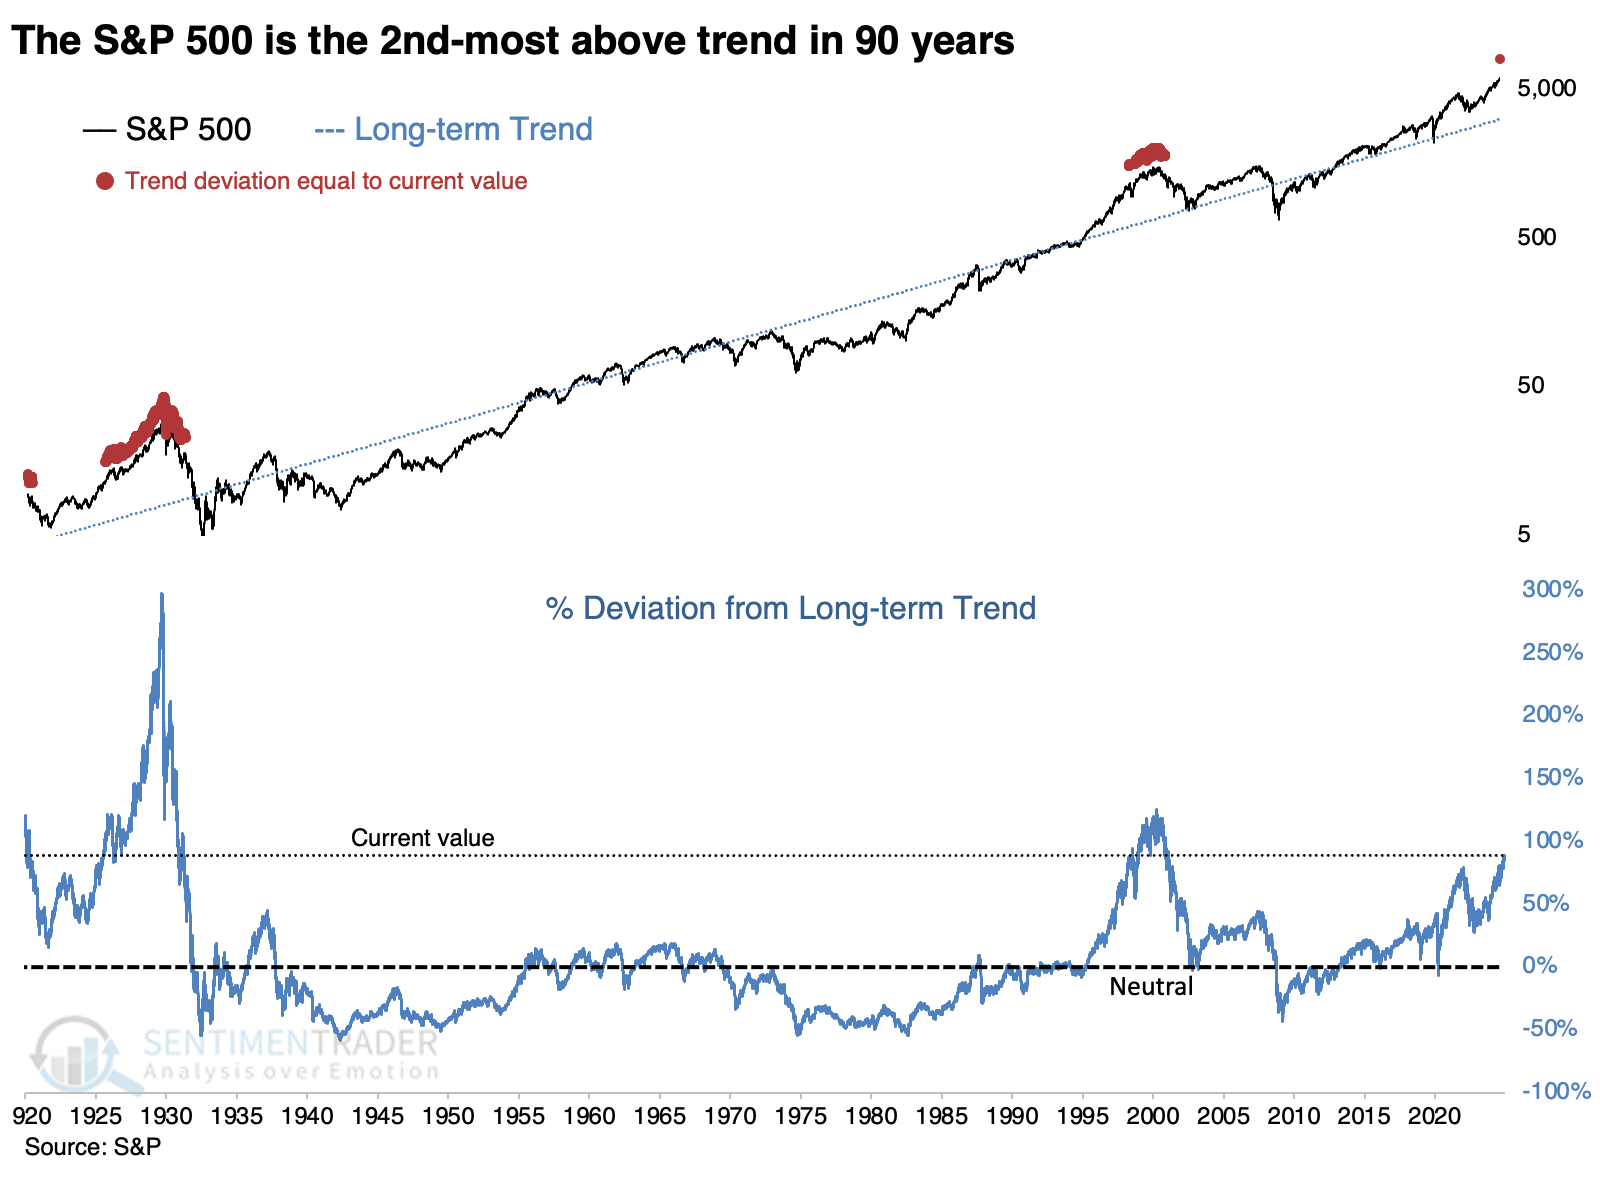
Over nearly two years, the most benchmarked equity index in the world has spent only a handful of days below its long-term trendline. Since mid-January 2023, the S&P 500 has spent 457 out of 471 sessions above its 200-day moving average. It hasn't done this much winning many times in its history.
Because of the persistency and magnitude of its gains, the S&P is far above its long-term trend. "Trend" can be defined in a nearly infinite number of ways. A fair way would be to measure its exponential trajectory and look at the current value relative to that trendline. The trend value should be such that the index has spent half of its trading sessions above trend and half below.
When we do those calculations, we get the result below. And it's not a particularly pretty picture, as it suggests the S&P is so far above its long-term trajectory that only the 2000 and 1920s bubbles can compare.
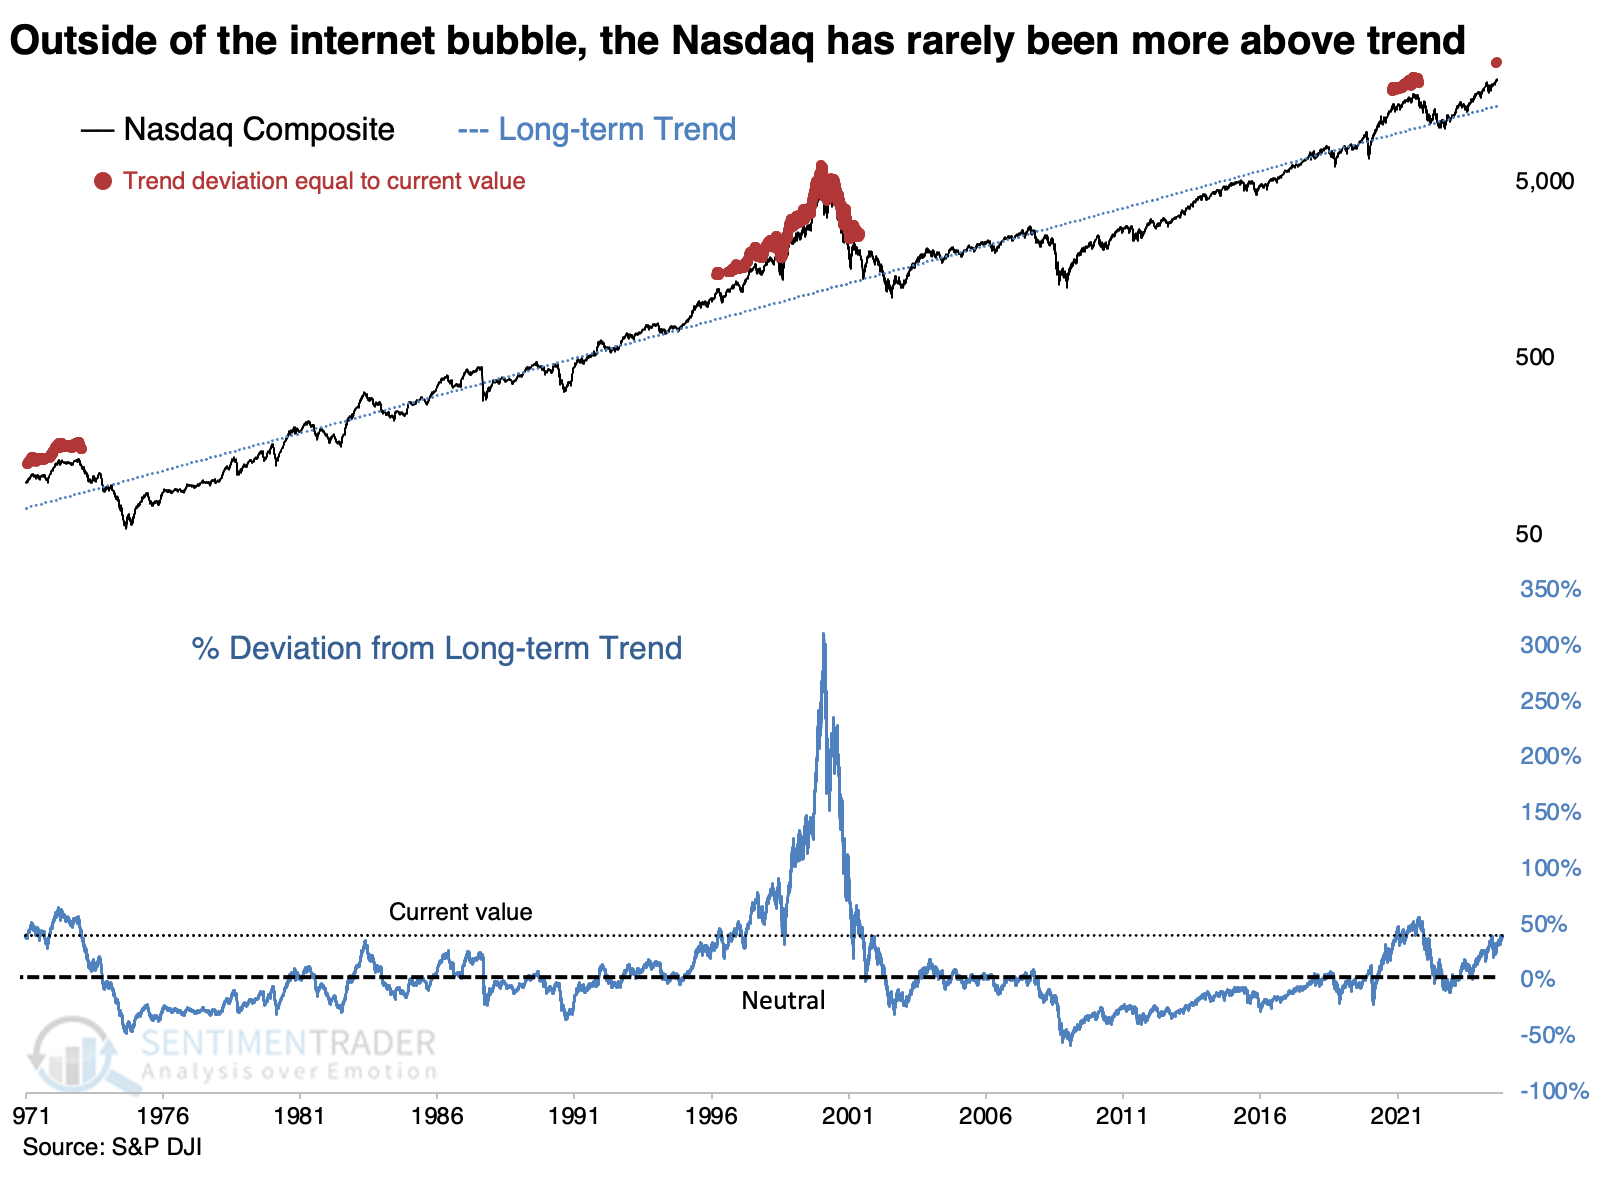
Much of the recent above-trend growth has been due to technology stocks, so we can do the same analysis for the Nasdaq Composite. But that index has had a different trajectory, and its recent performance isn't as exceptional as the S&P 500's.
Granted, just because it's not as extreme doesn't mean it isn't extreme at all. There have only been three distinct periods when the Nasdaq was this far above trend, all preceding years of disappointment for investors.
Of course, the late 1990s bubble seemed like nirvana at the time, and those who managed a timely exit were able to capture life-changing wealth. When this trend differential first hit an extreme in 1996, it would have been excruciating to sit in cash for another four years, watching limply as your neighbors bought McLarens and McMansions.
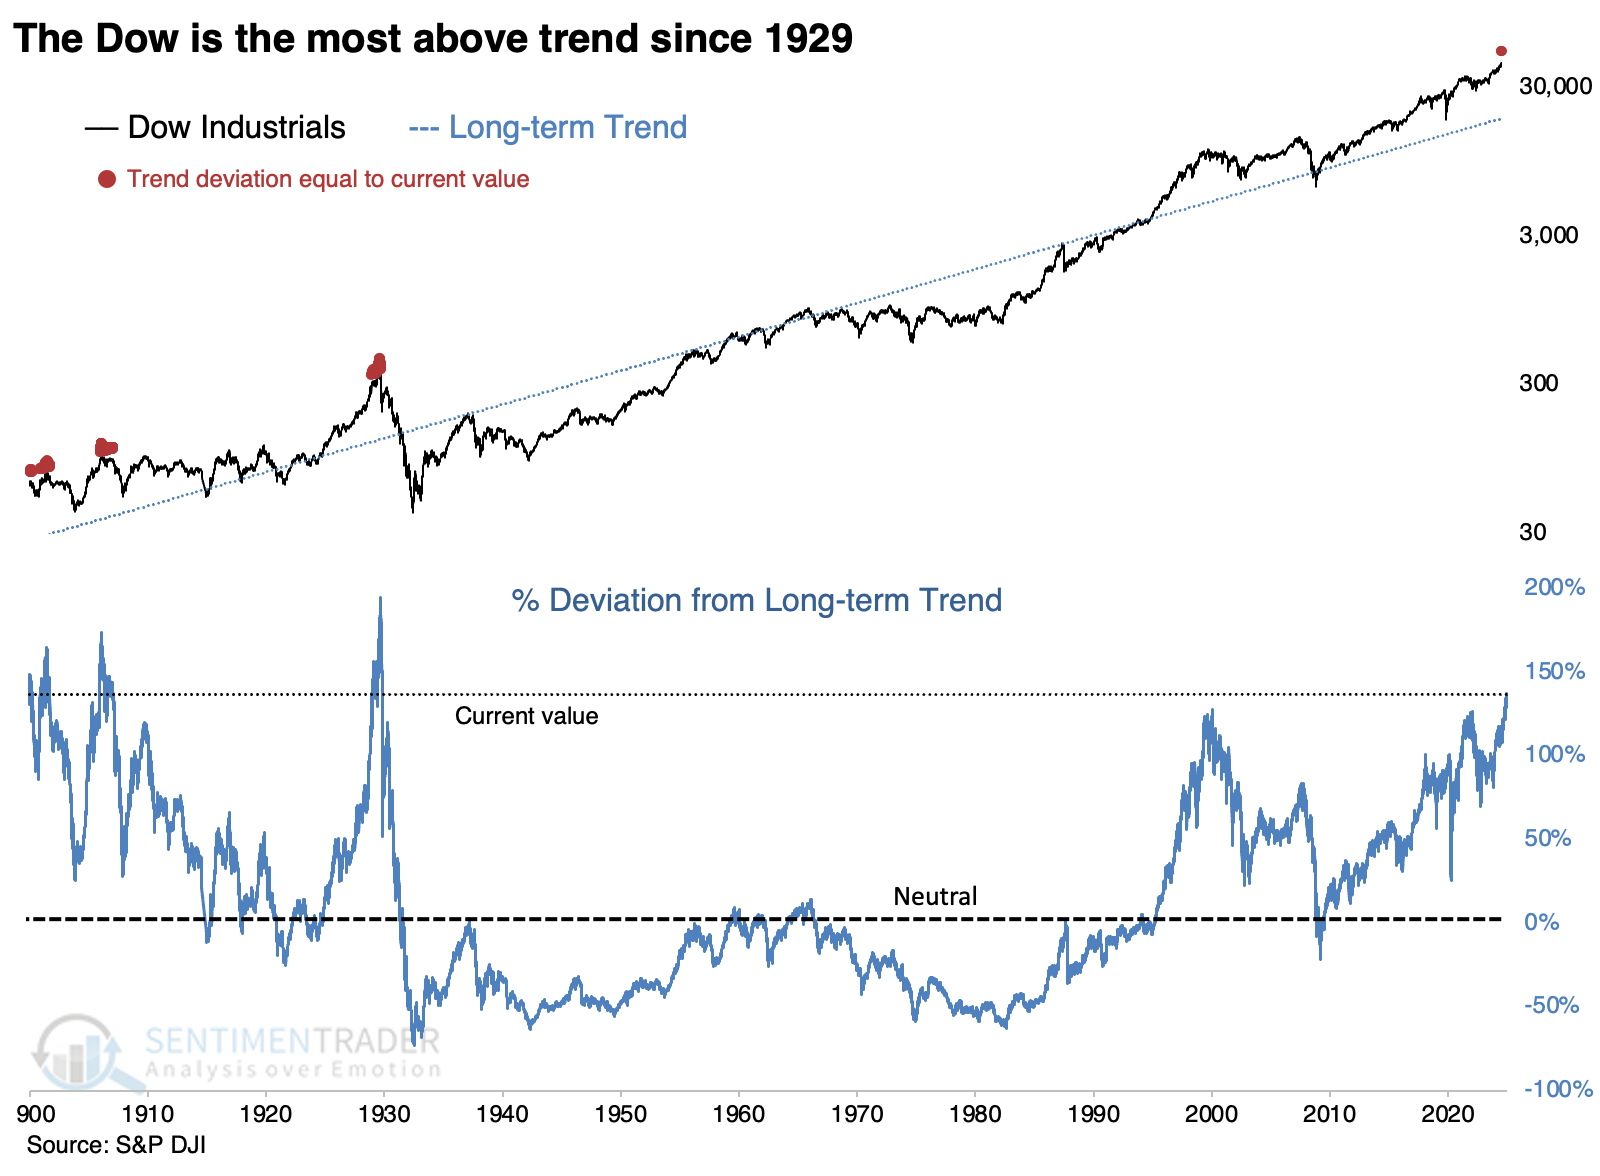
Oddly, the Nasdaq isn't even the most stretched relative to its long-term exponential trend. It's the granddaddy index, the Dow Jones Industrial Average. Industrials have done quite well over the past couple of years, and the Dow is further above its trend than at any point since 1900-01, 1906, and 1929. That's quite a feat.
In recent decades, the Dow exceeded 125% of its trend in January 2000 and January 2022, both leading to year(s) of frustration. But over the past month, it has blown past those extremes.
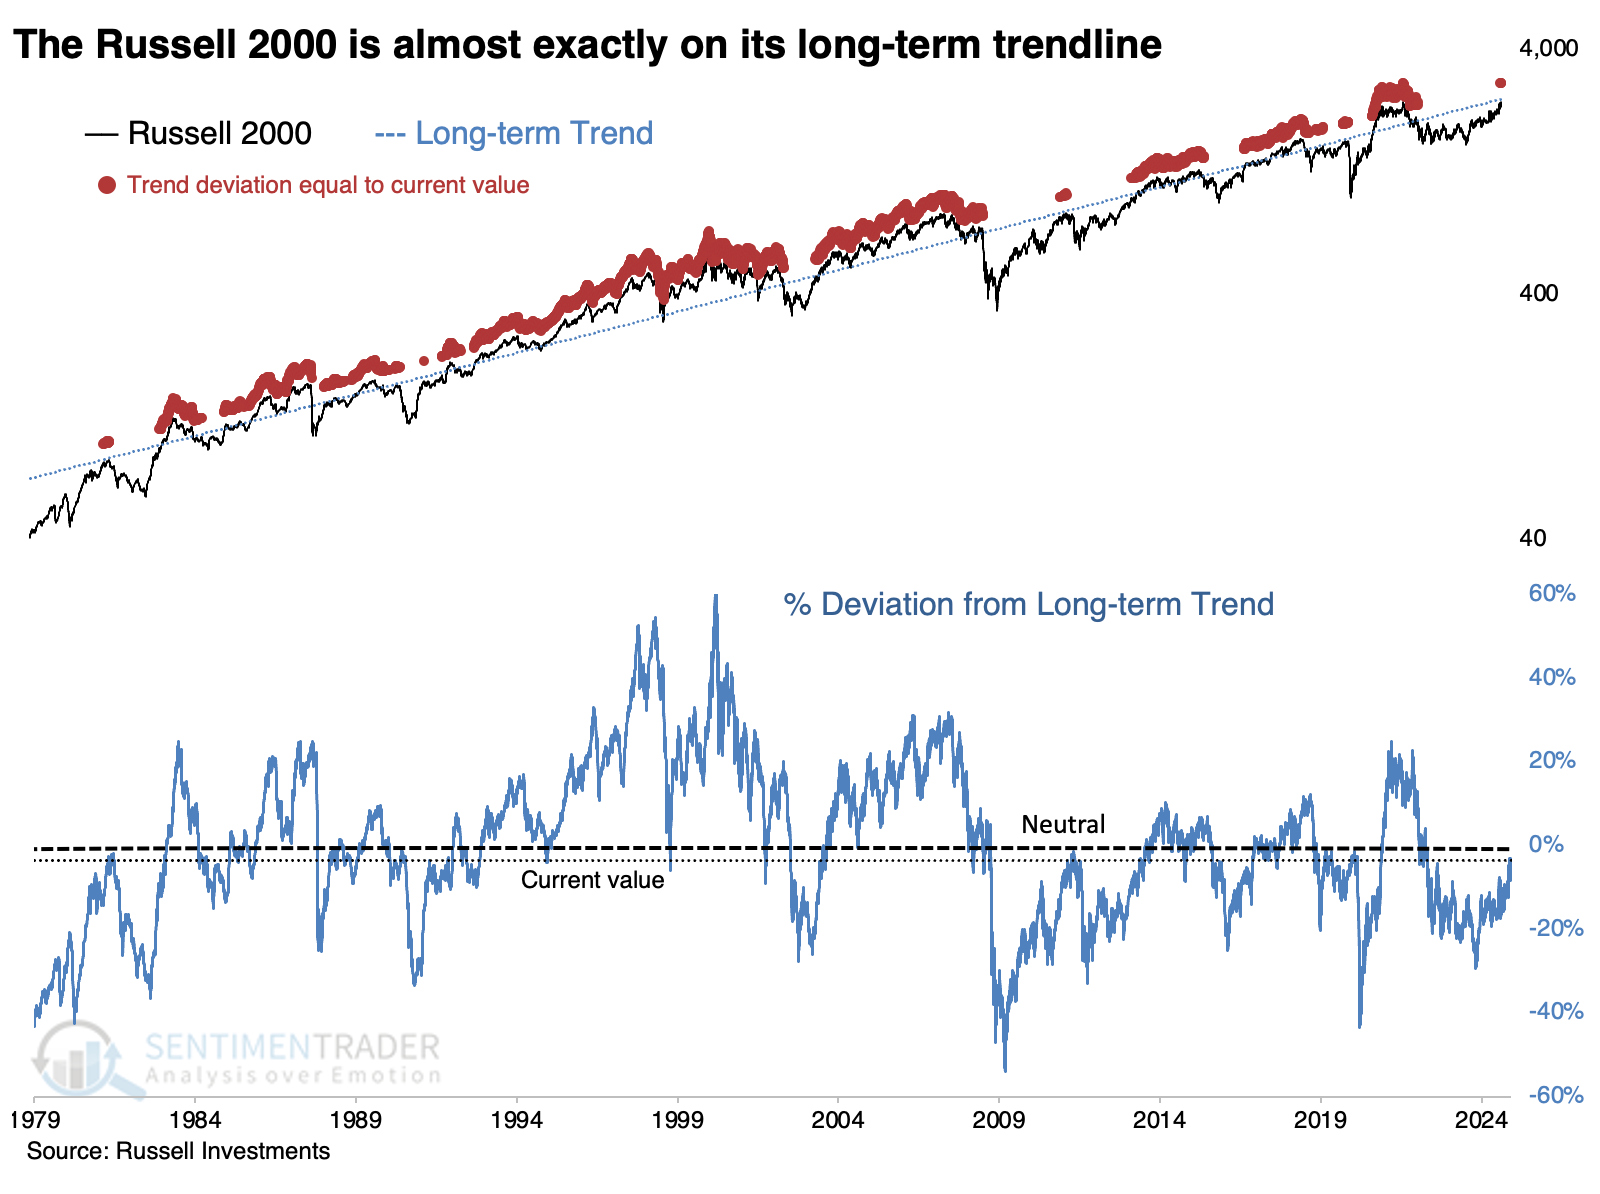
The only one of the "four horsemen" of U.S. equity indices that isn't wildly above trend is the small-cap Russell 2000. With its mini-surge following President Trump's re-election, the Russell has made it all the way to...breakeven. After being below it for years, it has only now climbed to its long-term exponential trend. It is neither above nor below trend in any significant way, which is a pretty good place to be.
A story of growth vs. value
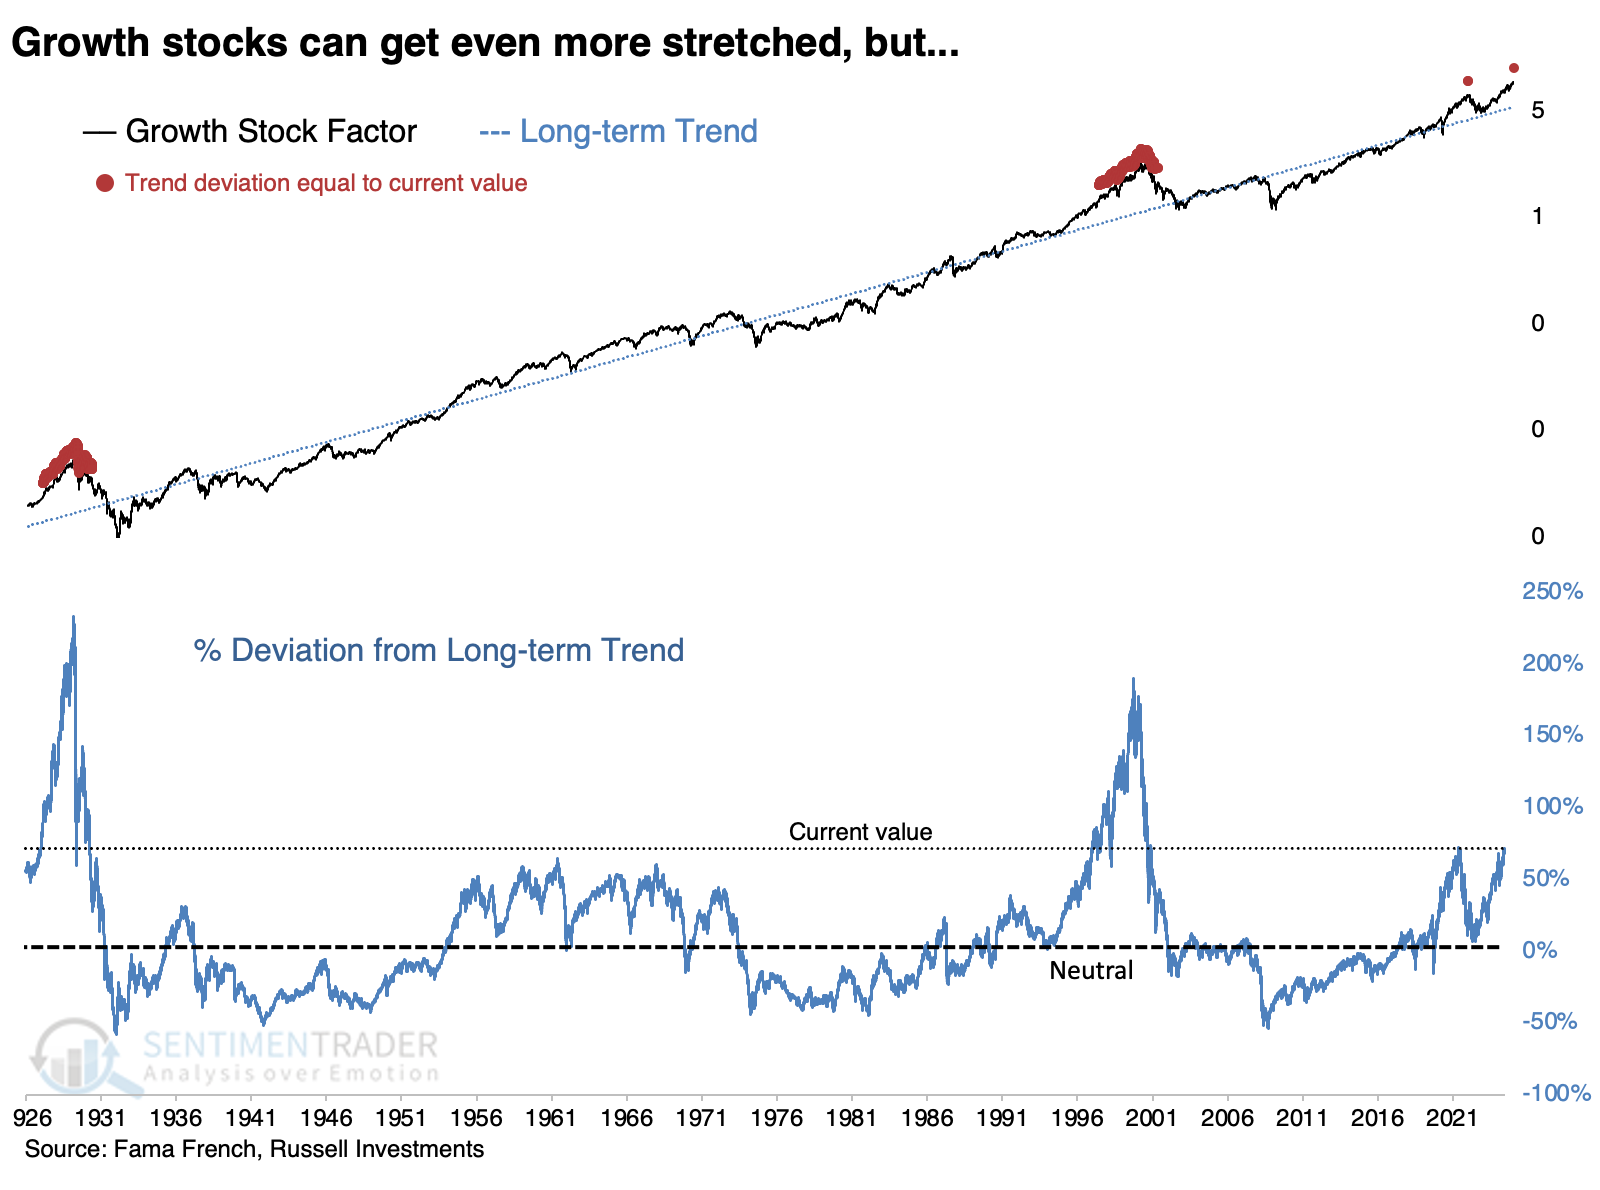
If we look at stocks broadly as either "growth" or "value", we can see how stark the difference is in their deviation from trend. The former is so far above its long-term trend that only a few of the most exceptional rallies can compare - those being 1929, 2000, and 2021.
The first two saw growth stocks continue to soar until they didn't and ultimately crashed. So, again, urging caution based on trend deviation depends on one's willingness to be content while others get disgustingly rich.
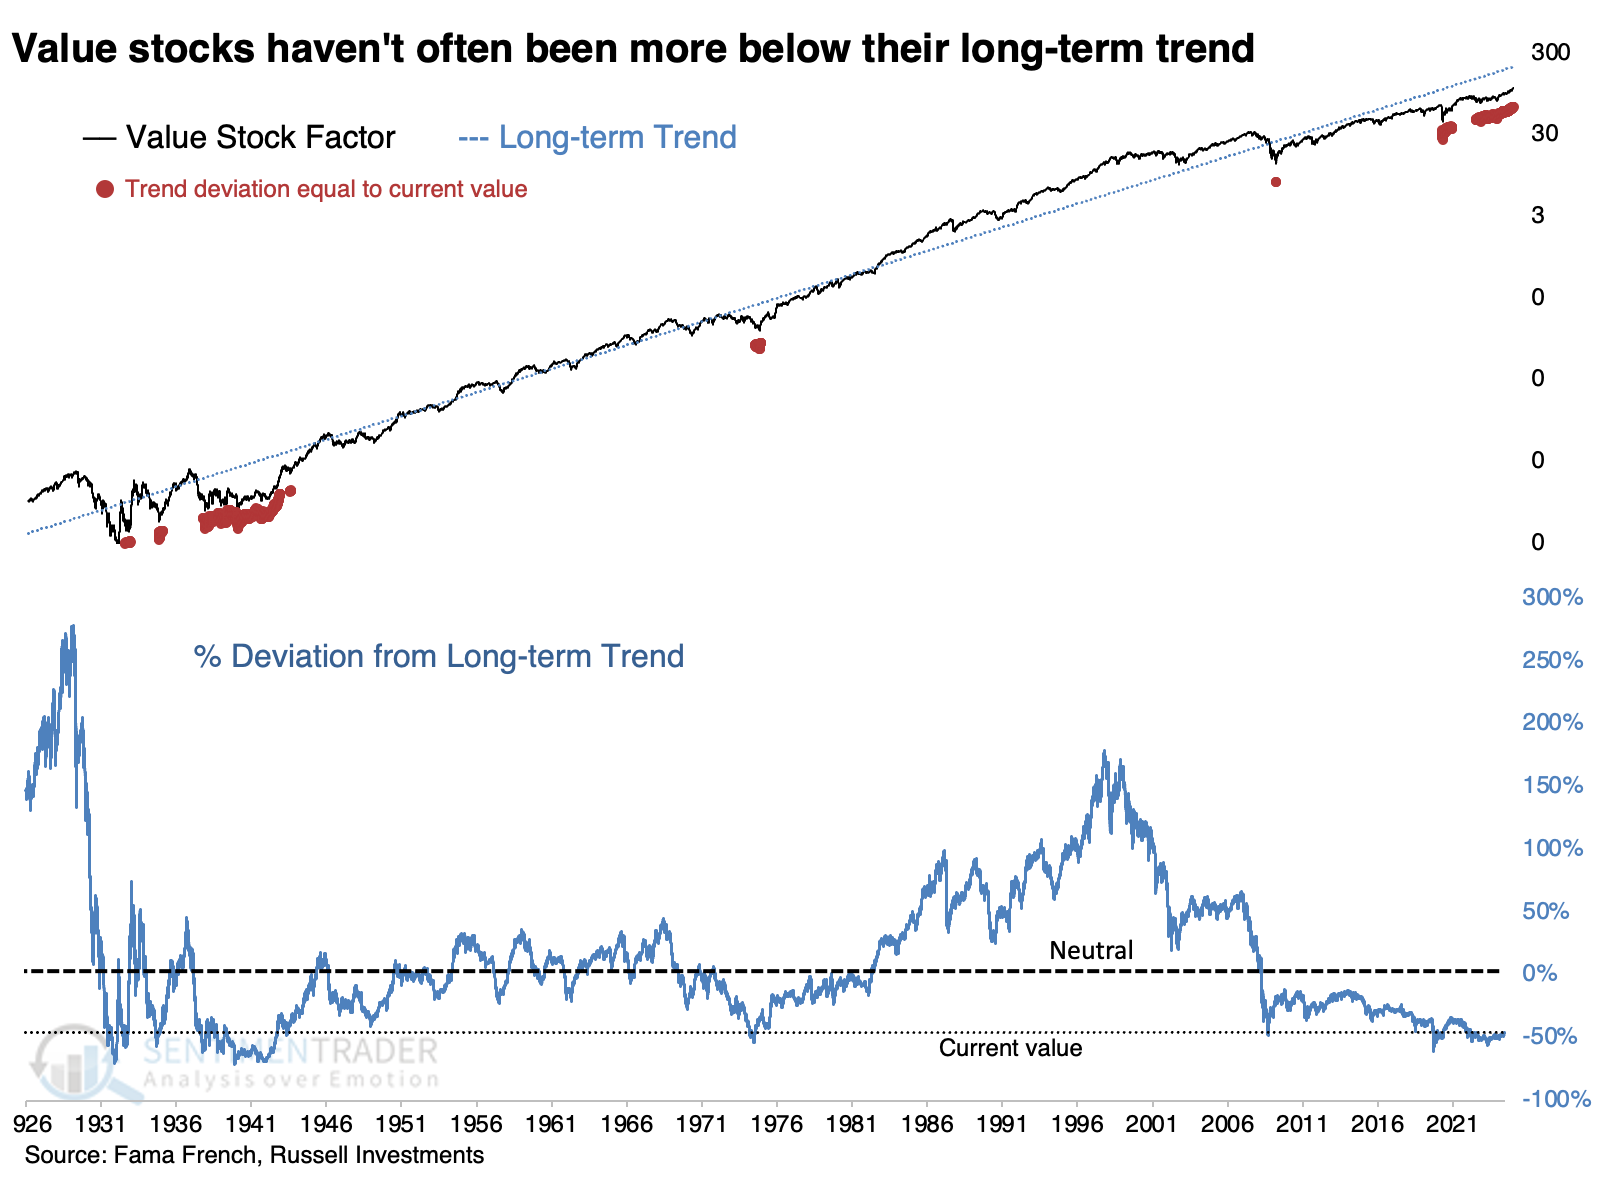
Those uncomfortable with chasing ever-rising prices of growth stocks can take solace in one of the only areas meaningfully below its long-term trend: the long-suffering value factor. These stocks have rarely been this far below trend over the past ~100 years, and all preceded excellent gains over the following years.
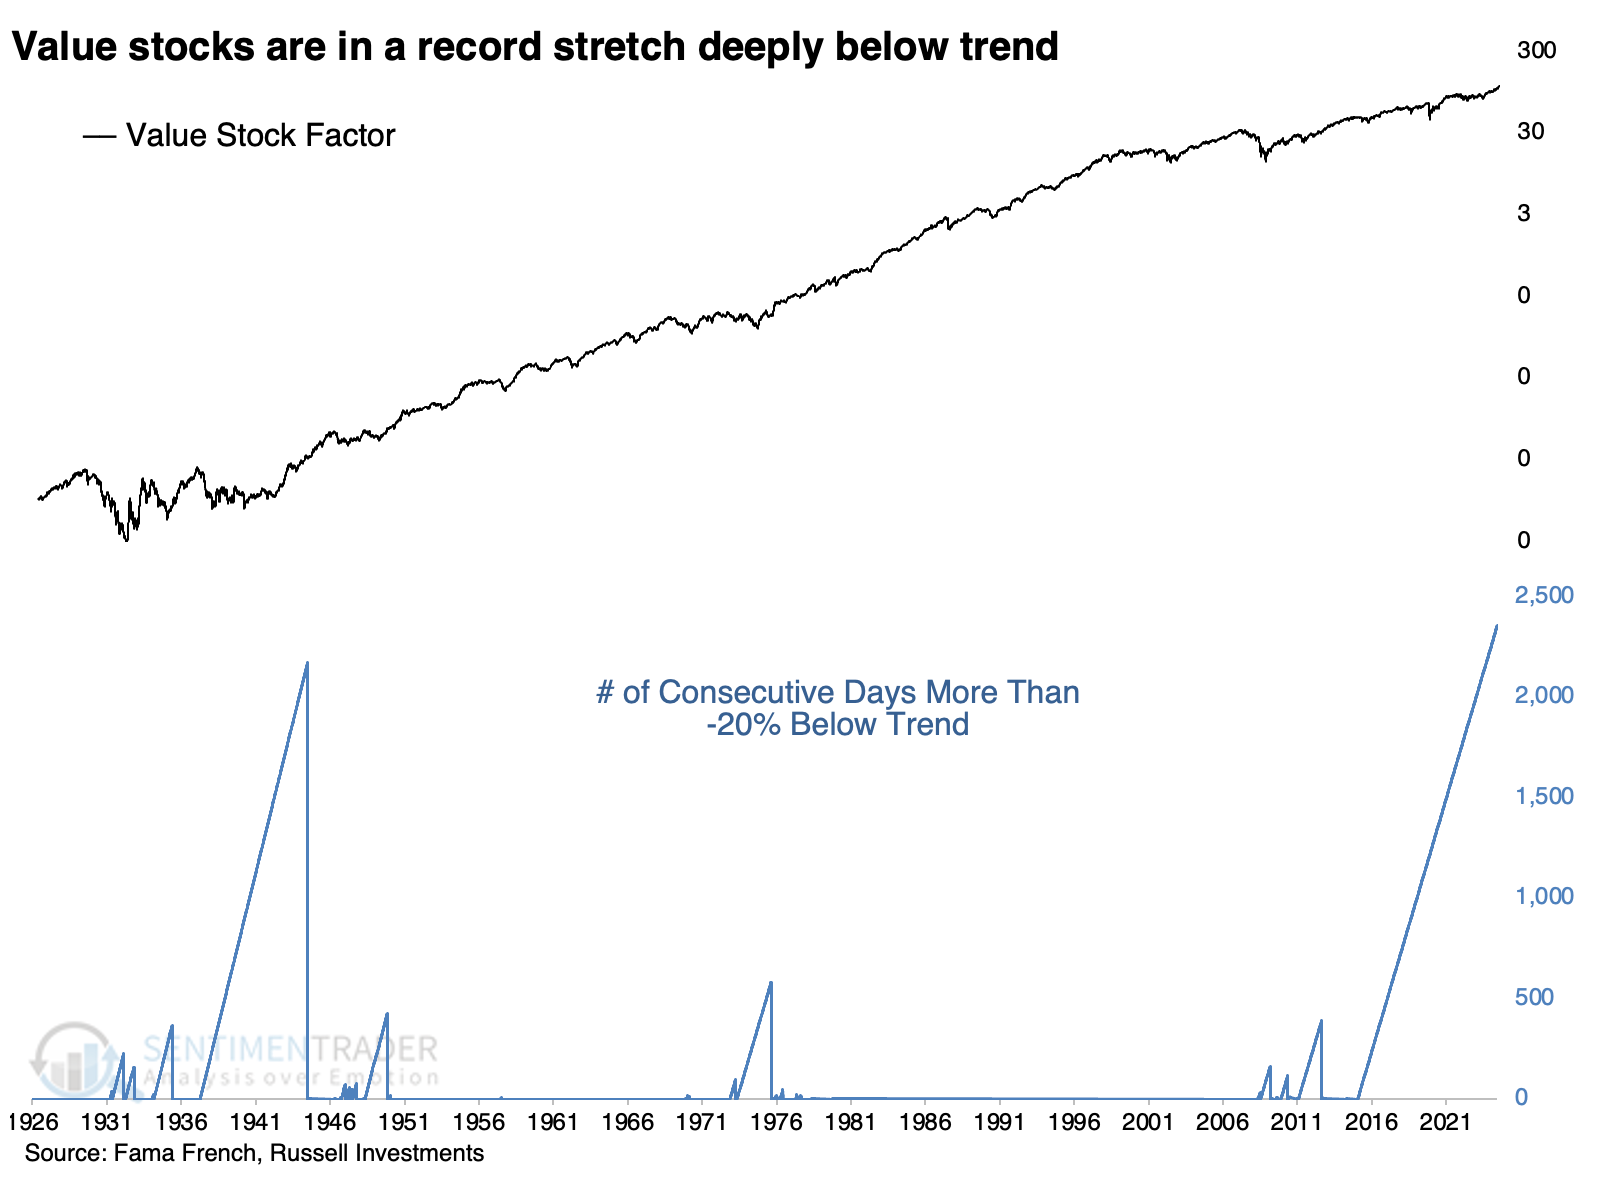
Value stocks have now gone more than nine years with at least a -20% discount to their long-term trend. The only period that compares is late 1943 through early 1944, after which value stocks went on a tear.
What the research tells us...
Comparing current values to historical trends presents the inherent weakness of perfect knowledge. There is no telling what stocks can do in the decades ahead relative to what they did in decades prior, which makes consulting historical growth rates an exercise in faith. That's not absurd, especially with nearly a hundred years of data.
When we look at the major indices, we can see how the last two years have stretched them relative to their (very) long-term historical performance. The only exception is the Russell 2000, which is only on trend at this point rather than wildly above. It's even better for value stocks, for which a strong case could be made are due (ugh, that word itself is a dangerous concept) for a multi-year resurgence.