Products
SentimenTrader Trading Tools
‍
Backtest Engine
My Trading Toolkit
Correlation Analysis
Seasonality
Market Prediction
Indicators & Data API
‍
Proprietary Indicators & Charts
Market Data API
Strategies & Scanner
‍
50+ Trading Strategies
Smart Stock Scanner
Smart Option Scanner
Research Reports
‍
Research Solutions
Reports Library
Free Resources
Simple Backtest Calculator
Simple Seasonality Calculator
The Kelly Criterion Calculator
Sentiment Geo Map
Public Research Reports
Education
Sentiment Indicators
Technical Indicators
Pricing
Company
About
In the News
Testimonials
Client Success Stories
Contact
Log inLoginSign up
< BACK TO ALL REPORTS

More than 90% of stocks in the technology sector are in a bear market

Dean Christians
2022-06-14
The number of S&P 500 technology sector members in a bear market exceeded 90% on 6/13/22. Let's assess the outlook for the sector after similar bear market conditions.

Key points:

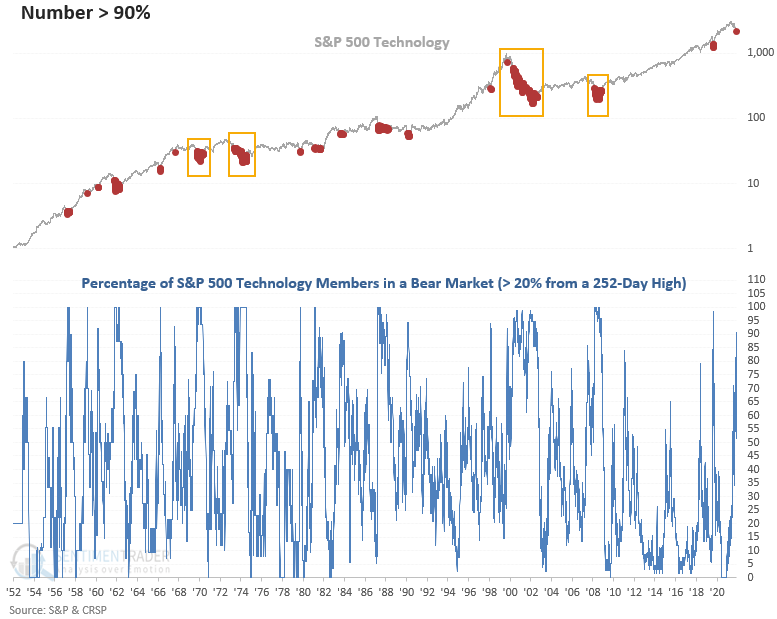
  • 90% of S&P 500 Technology stocks are down 20% or more from a 252-day high
  • After similar signals, the technology sector showed positive returns across all time frames 
  • On a relative basis, technology stocks underperformed the S&P 500 in the near term

What happens when more than 90% of S&P 500 Technology stocks fall into a bear market

Let's assess the outlook for the S&P 500 Technology sector after the number of index members trading down 20% or more from a 252-day high cross above 90%. I will include a reset that requires the number of stocks in a bear market to fall below 20% before a new signal can trigger again.

For only the second time in more than a decade, the number of Technology stocks in a bear market exceeded 90%. Several cases like 2007-08, 2000-02, 1973-74, and 1968-70 maintained a high level of stocks in a bear market for a significant amount of time, especially 2000-02.

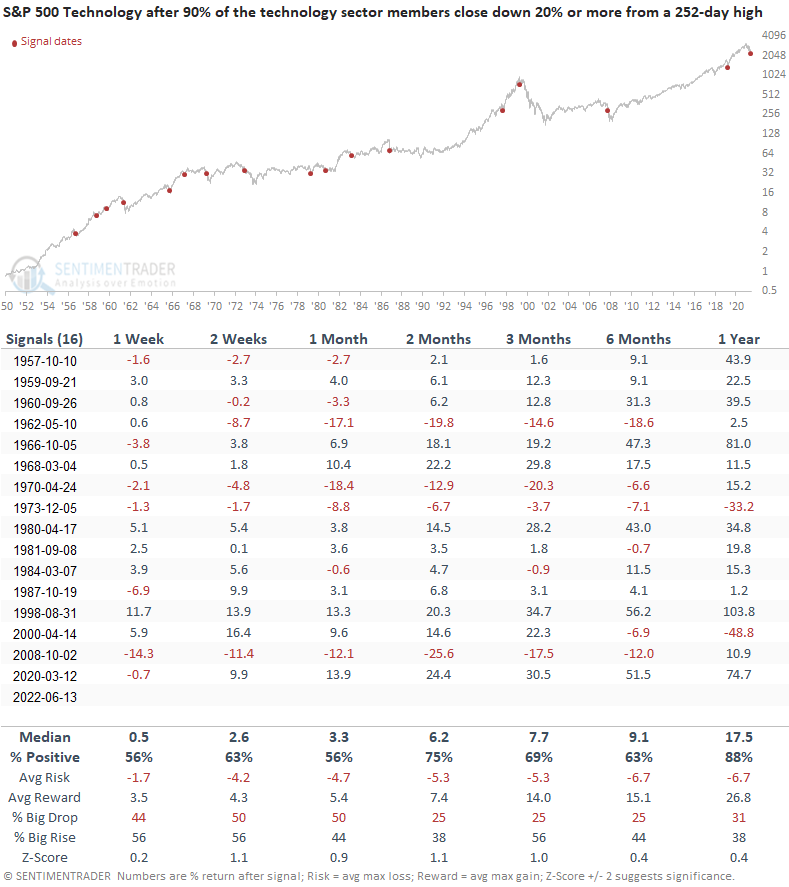
Similar signals preceded positive returns

This study generated a signal 16 other times over the past 65 years. After the others, S&P 500 Technology's future returns, win rates, and risk/reward profiles look favorable, especially in the 2 & 3-month time frames. While the 1-year window shows a solid return and hit rate, the z-score is uninspiring. I used the reset condition to identify the first instance. If I exclude it, the results will look less friendly, especially 2000-02.

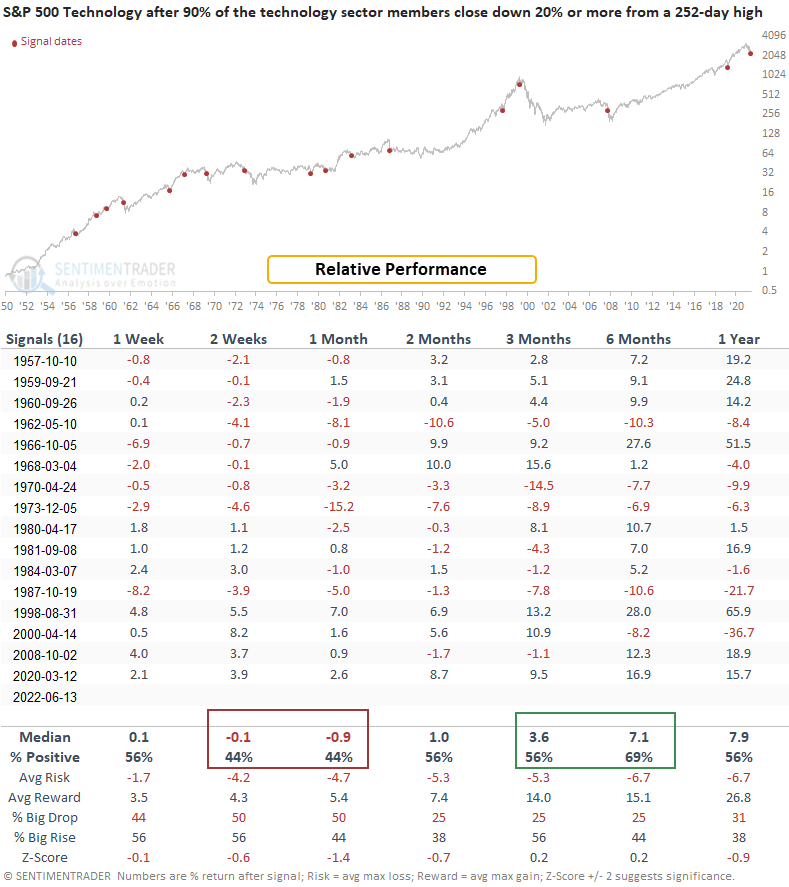
A relative comparison vs. the S&P 500 shows near-term underperformance

When I compare technology to the S&P 500, the tech sector tends to struggle in the 2-4 week time frames. However, more recent signals look better. The 3 and 6-month windows offer the best relative performance, with outperformance at some point in 12 out 16 instances. 

What the research tells us...

Internal trends are unhealthy when the number of S&P 500 technology members trading down 20% or more from a 252-day high exceeds 90%. Sometimes, breadth can be so bad that it's good. Similar setups to what we're seeing now have preceded positive returns for the technology sector, with more favorable results in the 2-3 month time frames. A relative comparison versus the S&P 500 shows the tech sector could underperform in the near term. However, the medium to long-term relative performance looks better, especially in the 3-6 month time frames. While the results look somewhat compelling, the bear market series is one of those indicators whereby one might be better suited to wait for a reversal downward before dipping your toes in the sand. The current environment may be one of those times.

PRODUCTS
SentimenTrader
Trading Tools
Indicators & Data API
‍
Strategies & Scanner
‍
Research Reports
FREE
RESOUrCES
Simple Backtest
Calculator
Simple Seasonality
Calculator
The Kelly Criterion
Calculator
Sentiment Geo Map
‍
Public Research Reports
‍
Education
Sentiment Indicators
‍
Technical Indicators
‍
Pricing
Bundle pricing
‍
FAQ
‍
Announcements
‍
COMPANY
‍
About
‍
In the News
‍
Testimonials
‍
Client Success Stories
CONTACT
‍
General Inquiries
‍
Media Inquiries
‍
Financial Professionals Inquiries
‍
© 2026 Sundial Capital Research Inc. All rights reserved.
Setsail Marketing
TermsPrivacyAffiliate Program
Risk Disclosure: The information and tools provided are for research and analytical purposes only and are not intended as investment advice. Market analysis involves uncertainty, and outcomes may differ from expectations. Users should conduct their own due diligence and consider their individual circumstances before making any financial decisions. Past performance is not necessarily indicative of future results.

Hypothetical Performance Disclosure: Hypothetical performance results have many inherent limitations, some of which are described below. No representation is being made that any account will or is likely to achieve profits or losses similar to those shown; in fact, there are frequently sharp differences between hypothetical performance results and the actual results subsequently achieved by any particular trading program. One of the limitations of hypothetical performance results is that they are generally prepared with the benefit of hindsight. In addition, hypothetical trading does not involve financial risk, and no hypothetical trading record can completely account for the impact of financial risk of actual trading. for example, the ability to withstand losses or to adhere to a particular trading program in spite of trading losses are material points which can also adversely affect actual trading results. There are numerous other factors related to the markets in general or to the implementation of any specific trading program which cannot be fully accounted for in the preparation of hypothetical performance results and all which can adversely affect trading results.

Testimonial Disclosure: Testimonials appearing on this website may not be representative of other clients or customers and is not a guarantee of future performance or success.