Products
SentimenTrader Trading Tools
‍
Backtest Engine
My Trading Toolkit
Correlation Analysis
Seasonality
Market Prediction
Indicators & Data API
‍
Proprietary Indicators & Charts
Market Data API
Strategies & Scanner
‍
50+ Trading Strategies
Smart Stock Scanner
Smart Option Scanner
Research Reports
‍
Research Solutions
Reports Library
Free Resources
Simple Backtest Calculator
Simple Seasonality Calculator
The Kelly Criterion Calculator
Sentiment Geo Map
Public Research Reports
Education
Sentiment Indicators
Technical Indicators
Pricing
Company
About
In the News
Testimonials
Client Success Stories
Contact
Log inLoginSign up
< BACK TO ALL REPORTS

More Tech stocks recapture their long-term uptrends

Jason Goepfert
2022-02-09
More technology stocks are recovering above their 200-day moving averages after an oversold extreme. Options bets against Financials are retreating.

More Technology stocks are recovering

Last week, we saw that Nasdaq stocks had staged a recovery, at least in terms of the percentage of them rising to 52-week highs versus those falling to 52-week lows.

While the Nasdaq is considered a tech index, that's not entirely accurate. Even so, there has been a recovery in long-term trends, specifically among Technology stocks. After fewer than 25% of Technology sector stocks were trading above their 200-day moving averages, enough recovered so that most of them were above their averages.

Tech stocks trying to recover over their 200-day averages

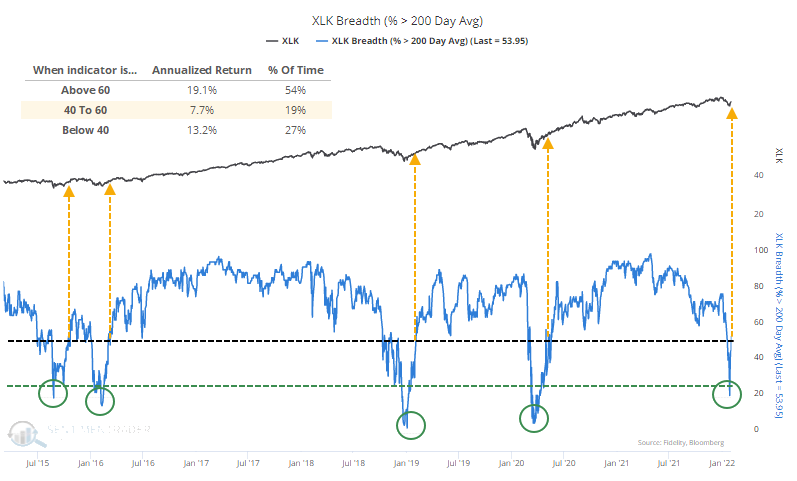
Part of the reason why we've seen a quick change is because so many of the stocks have been hovering right around their 200-day averages. As stocks have gyrated in recent months, those averages have flattened out, and more stocks are popping above and below them as prices whip back and forth.

It's generally better for Tech stocks if we see a thrust with more than 60% of them trading above their 200-day averages. So far, it's been hovering below 60%, which is what an unhealthy market does. We can see from the chart above that the total return on Technology stocks since 1952 was only 7.7% when the percentage of members was neutral, between 40% - 60%.

Stat box

For only the 2nd time in 15 years, 100% of Energy stocks have traded above their 200-day moving averages for 20 consecutive days. The other instance was April 2011.


Options bets against Financials are reversing

When investors are bullish on stocks, they buy call options to bet on rising prices. Conversely, when they are bearish on stocks, they purchase put options to bet on declining stocks. The put/call ratio can be used as a contrary indicator to identify an environment where sentiment has become too pessimistic on the future direction of stocks. When opinions become too bearish, stocks tend to rally.

Our aggregated put/call ratio indicator measures the summed options data for constituents of the index/ETF. Dean showed that over the past couple of weeks, options data on Financial stocks has reversed from a pessimistic extreme.

Options bets on Financials reverse from pessimistic extreme

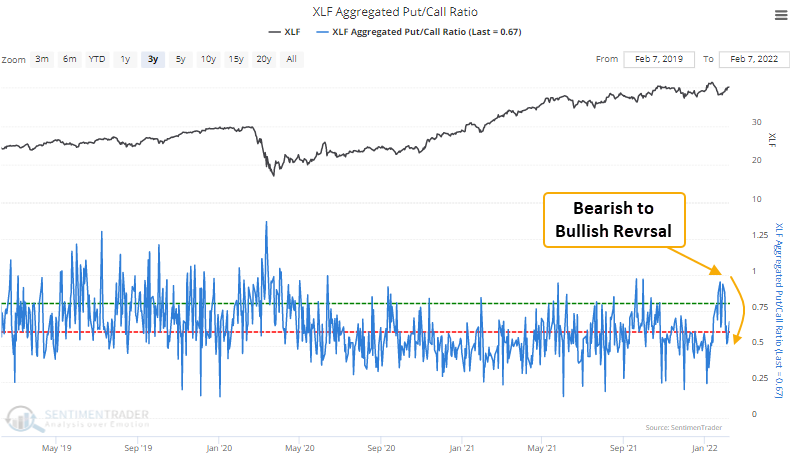
A model designed to capture reverses in sentiment in the sector has triggered about a dozen other times over the past decade.

PRODUCTS
SentimenTrader
Trading Tools
Indicators & Data API
‍
Strategies & Scanner
‍
Research Reports
FREE
RESOUrCES
Simple Backtest
Calculator
Simple Seasonality
Calculator
The Kelly Criterion
Calculator
Sentiment Geo Map
‍
Public Research Reports
‍
Education
Sentiment Indicators
‍
Technical Indicators
‍
Pricing
Bundle pricing
‍
FAQ
‍
Announcements
‍
COMPANY
‍
About
‍
In the News
‍
Testimonials
‍
Client Success Stories
CONTACT
‍
General Inquiries
‍
Media Inquiries
‍
Financial Professionals Inquiries
‍
© 2026 Sundial Capital Research Inc. All rights reserved.
Setsail Marketing
TermsPrivacyAffiliate Program
Risk Disclosure: The information and tools provided are for research and analytical purposes only and are not intended as investment advice. Market analysis involves uncertainty, and outcomes may differ from expectations. Users should conduct their own due diligence and consider their individual circumstances before making any financial decisions. Past performance is not necessarily indicative of future results.

Hypothetical Performance Disclosure: Hypothetical performance results have many inherent limitations, some of which are described below. No representation is being made that any account will or is likely to achieve profits or losses similar to those shown; in fact, there are frequently sharp differences between hypothetical performance results and the actual results subsequently achieved by any particular trading program. One of the limitations of hypothetical performance results is that they are generally prepared with the benefit of hindsight. In addition, hypothetical trading does not involve financial risk, and no hypothetical trading record can completely account for the impact of financial risk of actual trading. for example, the ability to withstand losses or to adhere to a particular trading program in spite of trading losses are material points which can also adversely affect actual trading results. There are numerous other factors related to the markets in general or to the implementation of any specific trading program which cannot be fully accounted for in the preparation of hypothetical performance results and all which can adversely affect trading results.

Testimonial Disclosure: Testimonials appearing on this website may not be representative of other clients or customers and is not a guarantee of future performance or success.