Products
SentimenTrader Trading Tools
‍
Backtest Engine
My Trading Toolkit
Correlation Analysis
Seasonality
Market Prediction
Indicators & Data API
‍
Proprietary Indicators & Charts
Market Data API
Strategies & Scanner
‍
50+ Trading Strategies
Smart Stock Scanner
Smart Option Scanner
Research Reports
‍
Research Solutions
Reports Library
Free Resources
Simple Backtest Calculator
Simple Seasonality Calculator
The Kelly Criterion Calculator
Sentiment Geo Map
Public Research Reports
Education
Sentiment Indicators
Technical Indicators
Pricing
Company
About
In the News
Testimonials
Client Success Stories
Contact
Log inLoginSign up
< BACK TO ALL REPORTS

More signs of bullish optimism

Dean Christians
2023-08-01
The Conference Board's net percentage of consumers expecting stocks to increase minus decrease shifted from pessimism to optimism, triggering a bullish signal for stocks. After similar alerts, the S&P 500 was higher a year later in all but one case. A survey measuring active investment managers rose to 100% invested for the first time in a year, suggesting a bullish backdrop for stocks over the next year.

Key points:

  • The net % of consumers expecting stocks to increase minus decrease cycled from < -19% to 8% 
  • Similar reversals in consumer expectations for stock prices preceded excellent returns for the S&P 500
  • The National Association of Active Manager's exposure index rose above 100% for the first time in a year

Consumers and active managers are feeling better about the outlook for stocks

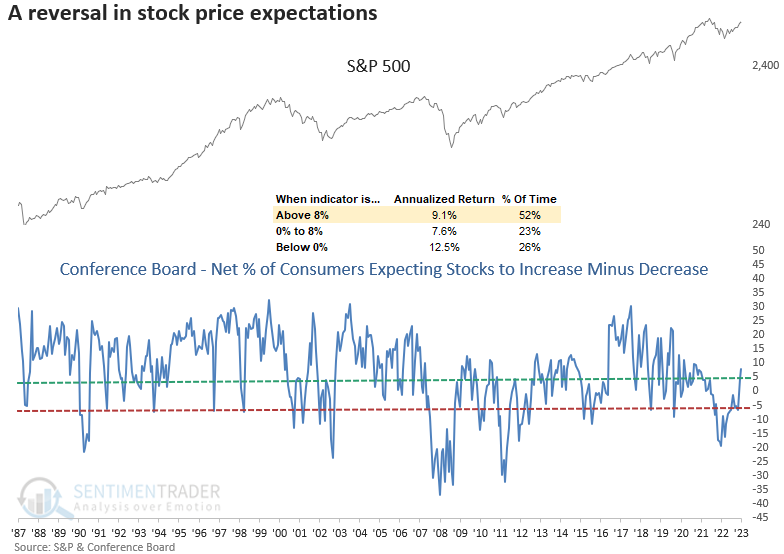
After falling to the 5th lowest reading in history, the Conference Board's net percentage of consumers expecting stocks to increase minus decrease rose to 8% with the July update last week. The survey, which measures 3000 households, confirms what we have seen from several other sentiment indicators: a reversal from pessimism to optimism. 

When the net % of consumers expecting stocks to increase minus decrease reaches 8%, like now, the S&P 500 annualizes at 9.1%. It's crucial to note that annual returns only turn negative when the spread exceeds 28%. So, there is a substantial margin between the current reading and the danger zone. 

Similar reversals in consumer expectations for stocks preceded excellent returns

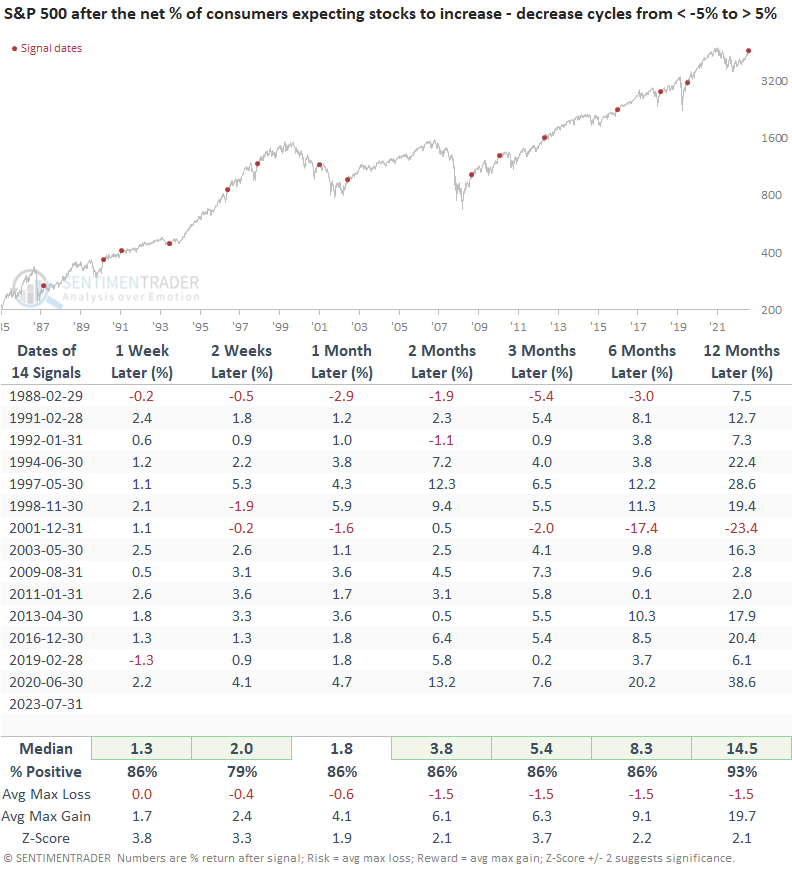
When the spread for consumer expectations on stocks cycles from less than -5% to greater than 5%, returns, win rates, and z-scores for the S&P 500 are excellent. A year later, the world's most benchmarked index was higher in all but one precedent. The only whipsaw signal occurred in 2001 when the S&P 500 was entrenched in a significant downtrend, which is not the case now.

 I adjusted the threshold levels to increase the sample size.

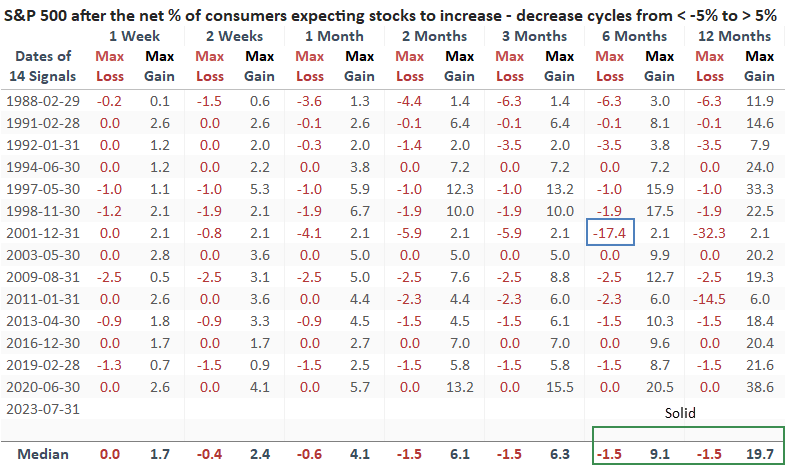
Over the next six months, the S&P 500 suffered only one max loss of greater than -6.3%. A year later, the risk/reward skew was astonishing as the median gain far surpassed the median loss.

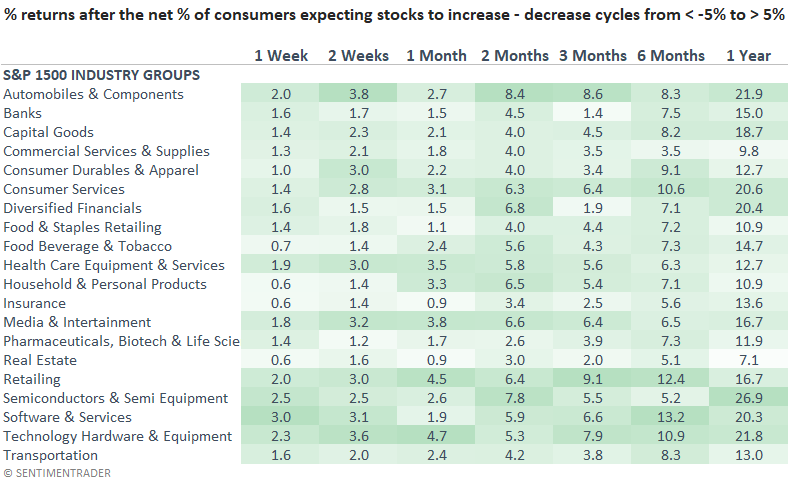
History suggests sentiment shifts like the one occurring now are favorable for the Consumer Discretionary and Technology sectors, aligning with bullish relative trends for those groups. While Financials do well, the industry is struggling on a comparable basis.

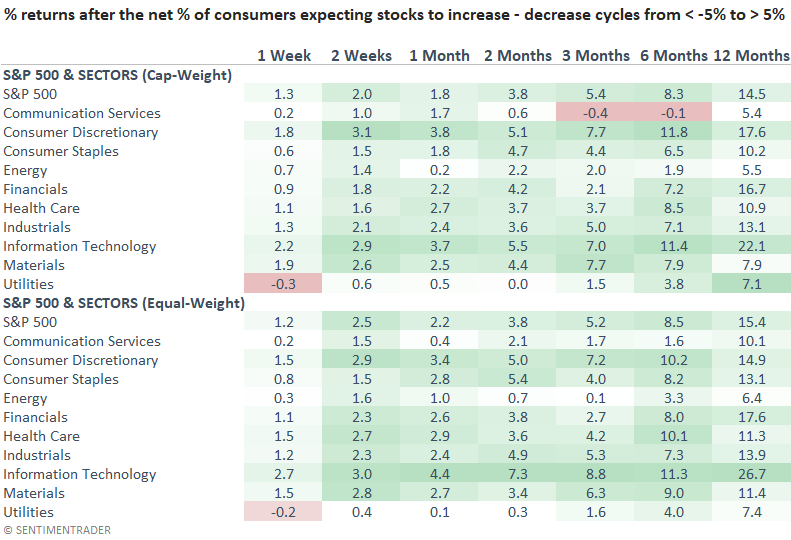
Semiconductors, another relative winner this year, outperform all other industries when consumer expectations on stocks shift like now. 

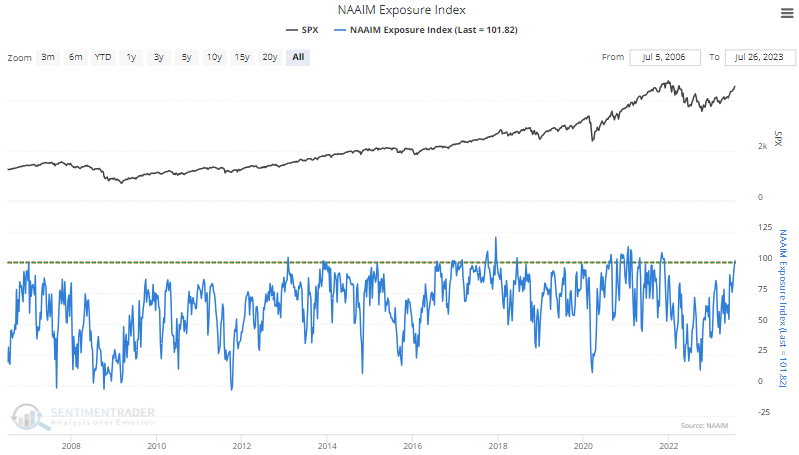
Active managers are fully invested, according to a survey

The National Association of Active Investment Managers (NAAIM) exposure index crossed above 100% for the first time in a year. The index measures the average exposure to US Equity markets reported by members and can range from 200% long to -200% short. A level of 100% implies investors are fully invested.

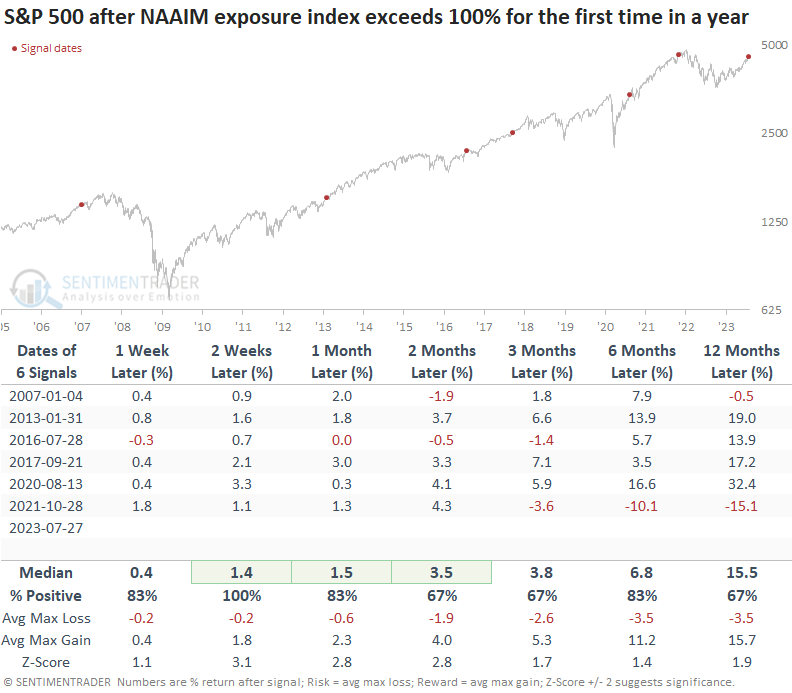
While the sample size is small, when the exposure index crosses above 100% for the first time in a year, the S&P 500 consistently rises over the next year. Moreover, despite being fully invested, stocks tend to follow through in the near term, with a 100% win rate two weeks later.

What the research tells us...

As we've seen with other sentiment surveys and real money indicators, shifts from pessimism to optimism are bullish for equity markets. Remember, sentiment, like valuations, is a pre-condition. Other factors, such as market breadth, must deteriorate before we should be concerned about a significant drawdown. Consolidations and 3-5% corrections can occur out of nowhere and are extremely difficult to market time. That's why my TCTM Composite Risk Warning Model contains big-picture algorithms.

PRODUCTS
SentimenTrader
Trading Tools
Indicators & Data API
‍
Strategies & Scanner
‍
Research Reports
FREE
RESOUrCES
Simple Backtest
Calculator
Simple Seasonality
Calculator
The Kelly Criterion
Calculator
Sentiment Geo Map
‍
Public Research Reports
‍
Education
Sentiment Indicators
‍
Technical Indicators
‍
Pricing
Bundle pricing
‍
FAQ
‍
Announcements
‍
COMPANY
‍
About
‍
In the News
‍
Testimonials
‍
Client Success Stories
CONTACT
‍
General Inquiries
‍
Media Inquiries
‍
Financial Professionals Inquiries
‍
© 2026 Sundial Capital Research Inc. All rights reserved.
Setsail Marketing
TermsPrivacyAffiliate Program
Risk Disclosure: The information and tools provided are for research and analytical purposes only and are not intended as investment advice. Market analysis involves uncertainty, and outcomes may differ from expectations. Users should conduct their own due diligence and consider their individual circumstances before making any financial decisions. Past performance is not necessarily indicative of future results.

Hypothetical Performance Disclosure: Hypothetical performance results have many inherent limitations, some of which are described below. No representation is being made that any account will or is likely to achieve profits or losses similar to those shown; in fact, there are frequently sharp differences between hypothetical performance results and the actual results subsequently achieved by any particular trading program. One of the limitations of hypothetical performance results is that they are generally prepared with the benefit of hindsight. In addition, hypothetical trading does not involve financial risk, and no hypothetical trading record can completely account for the impact of financial risk of actual trading. for example, the ability to withstand losses or to adhere to a particular trading program in spite of trading losses are material points which can also adversely affect actual trading results. There are numerous other factors related to the markets in general or to the implementation of any specific trading program which cannot be fully accounted for in the preparation of hypothetical performance results and all which can adversely affect trading results.

Testimonial Disclosure: Testimonials appearing on this website may not be representative of other clients or customers and is not a guarantee of future performance or success.