
More signs of a bullish backdrop for the average stock

Key points:
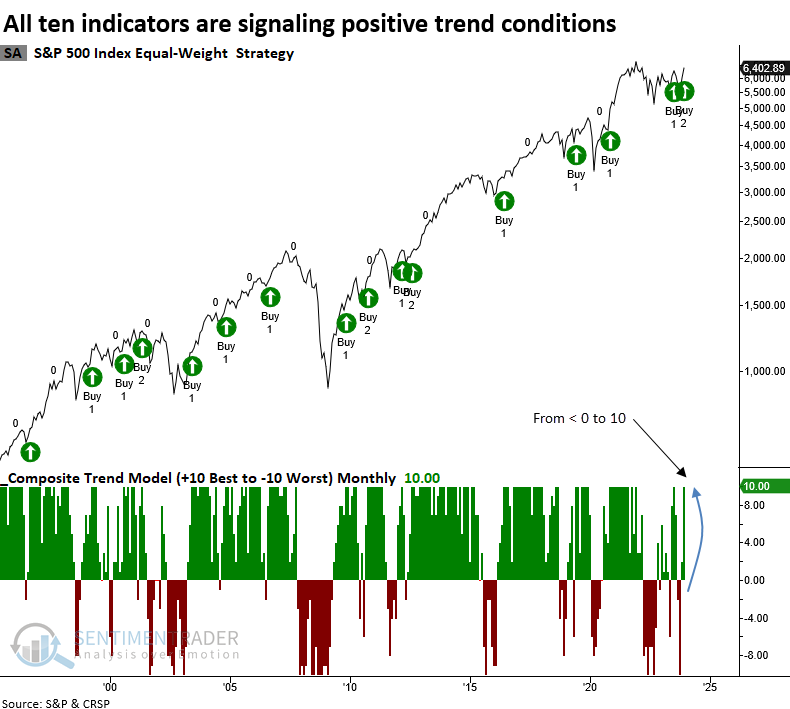
- A composite trend model for the equal-weighted S&P 500 index increased to a perfect score of ten
- Similar composite shifts led to outstanding results for the index that assigns equal weights to each member
- The equal-weighted S&P 500 index outperformed the cap-weighted version across all time horizons
It's a market of stocks, not a stock market
The final quarter of 2023 witnessed a notable surge in most stocks, prompting multiple breadth-based signals that pointed toward widespread participation. Consequently, a composite model that assesses ten trend-following indicators for the equal-weighted S&P 500 index using monthly data climbed to its highest attainable level.
Now that both internal and external trend indicators are in agreement, the likelihood of the sustainability of the cyclical uptrend that commenced in October 2022 looks more compelling. With a tailwind at our back, traders and investors should concentrate on pinpointing the strongest sectors, industries, and stocks using a simple but effective concept like relative strength.
Similar composite signals preceded a robust outlook for the equal-weighted index
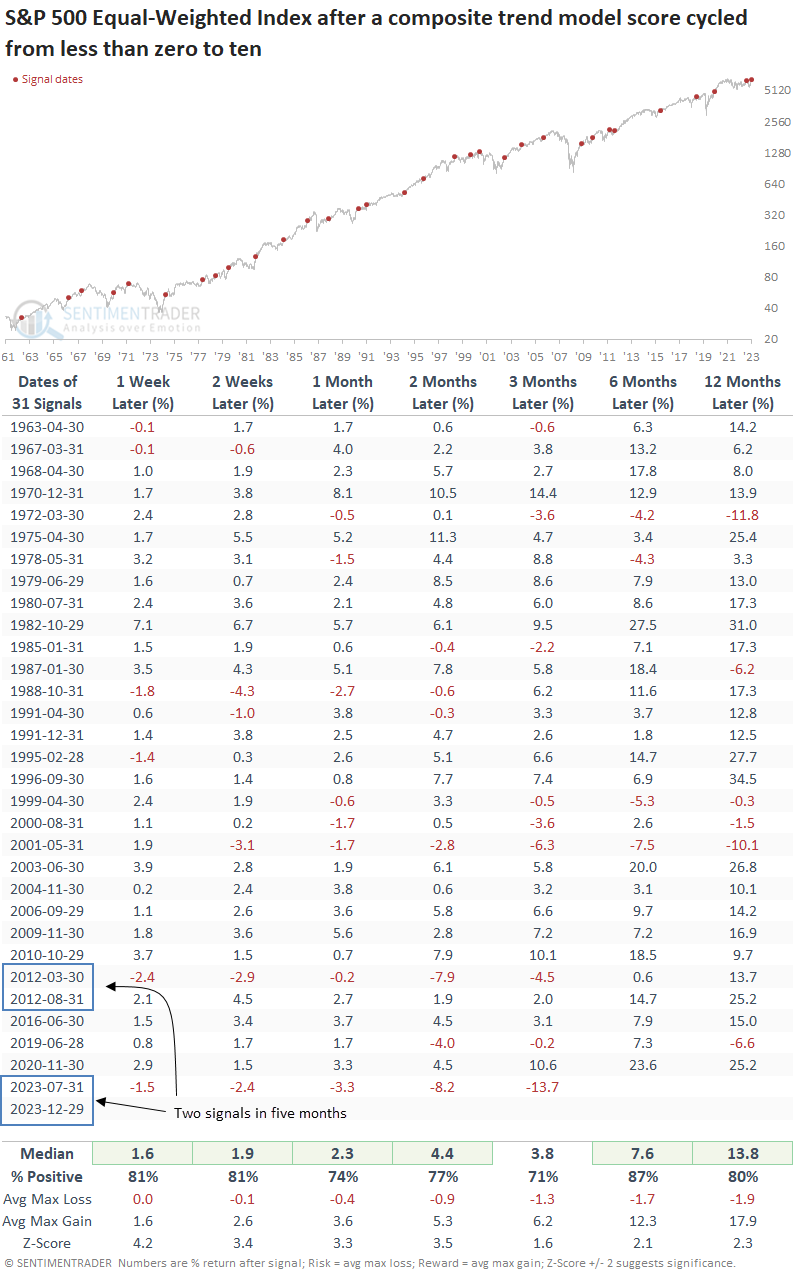
Whenever the composite trend model for the equal-weighted S&P 500 shifted from below zero to a perfect score of ten, indicating consensus among all trend-following components, the index that evenly distributes weight to each member displayed excellent returns and win rates.
While the previous signal from July 2023 marked a multi-month peak for stocks, the occurrence of a second signal in a five-month period, like now, is a rarity. The last instance of back-to-back alerts in five months or fewer took place in 2012, and it resulted in an exceptionally bullish market.
Should we allocate capital to the equal or cap-weighted S&P 500?
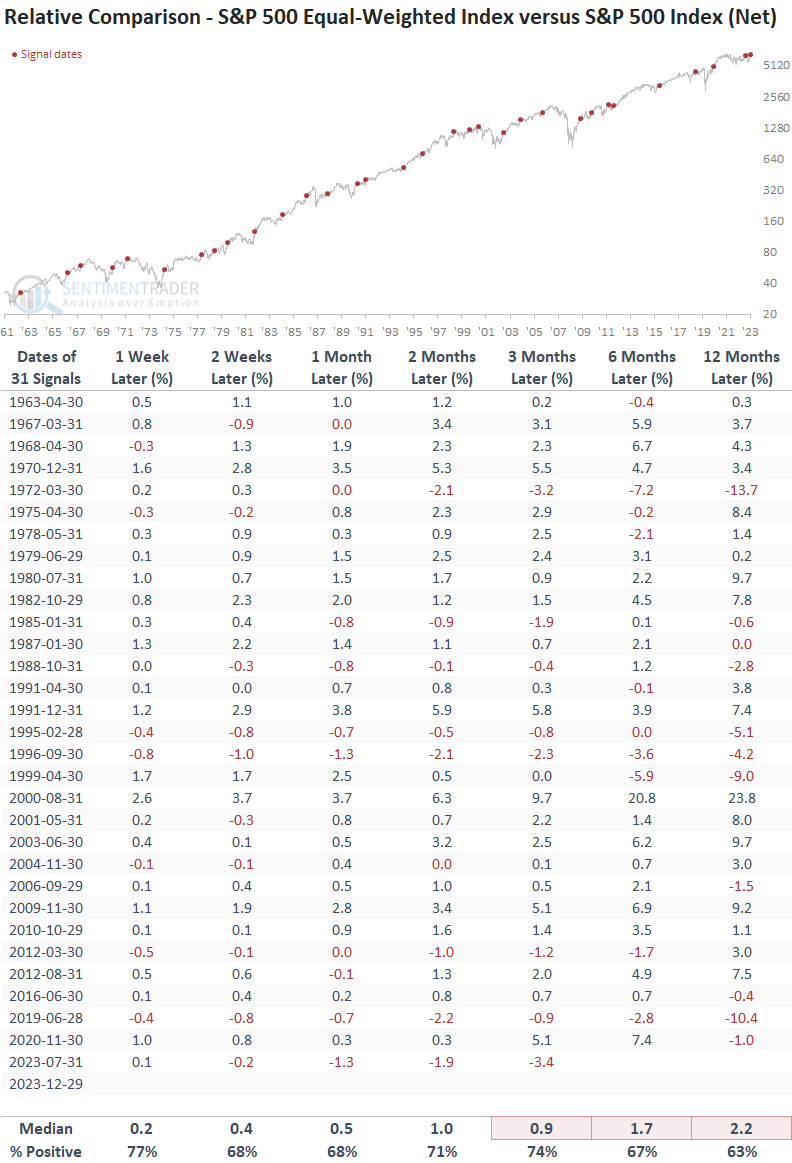
The median return for the equal-weighted S&P 500 index exceeded the cap-weighted version across all time frames, with win rates ranging from 63% to 77%.
An even more bullish reversal scenario
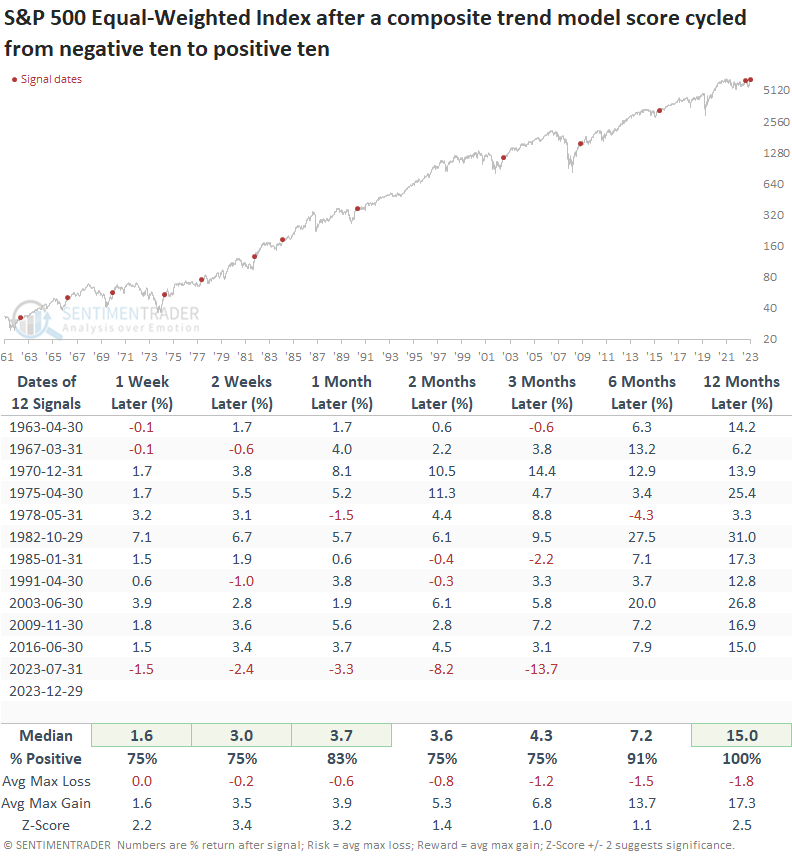
While the sample size is smaller, when the composite cycled from negative ten to positive ten, like now, the equal-weighted S&P 500 index was higher a year later every time.
Where should we be looking for ideas now that more stocks are participating?
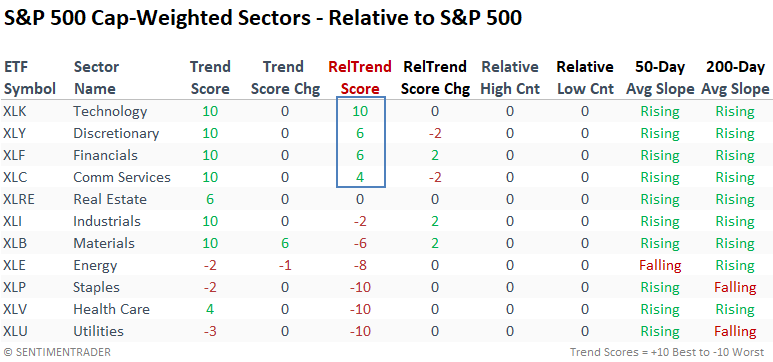
The cap-weighted S&P 500 sectors continue to favor growth-oriented groups like Technology, Consumer Discretionary, and Communication Services, which are dominated by a handful of meg-cap members. However, Financials maintain a positive relative trend score, which is even more pronounced at the industry level.
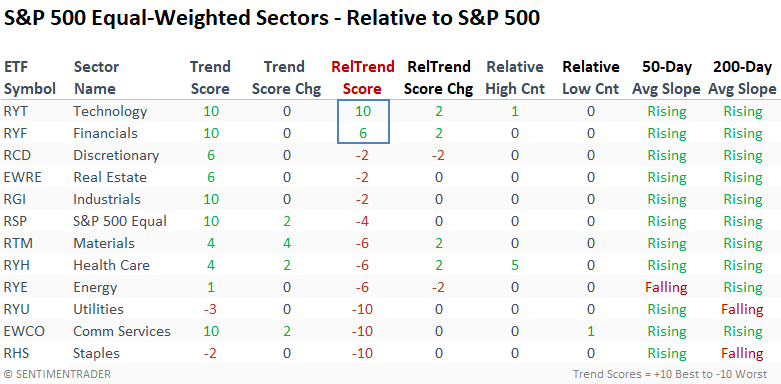
The equal-weighted Financials sector is only one of two groups to exhibit a positive relative trend score compared to the S&P 500.
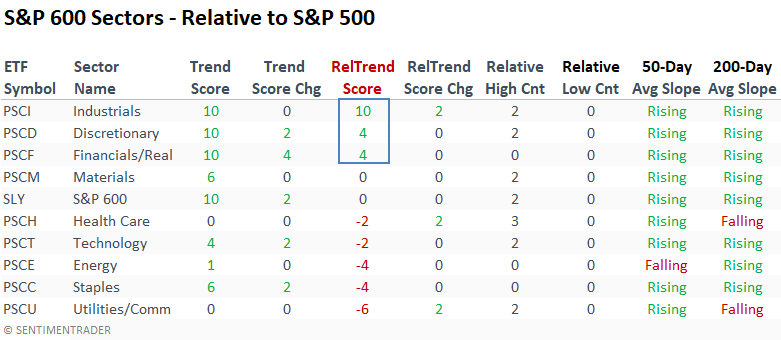
Small-cap stocks, known for their higher correlation with the S&P 500 equal-weighted index, are exhibiting robust performance in the industrial sector, maintaining flawless absolute and relative trend scores.
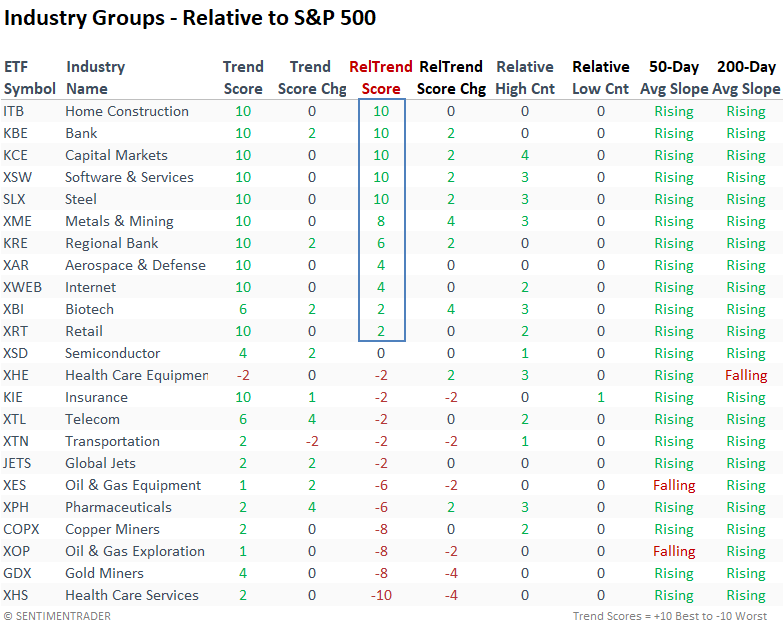
When I drill down to industries, Banks, Capital Markets, and Regional Banks exhibit solid relative trend scores versus the S&P 500. While Steel and the Metals and Mining ETFs show notable improvement, the uptick in scores can be attributed to the takeover announcement in U.S. Steel.
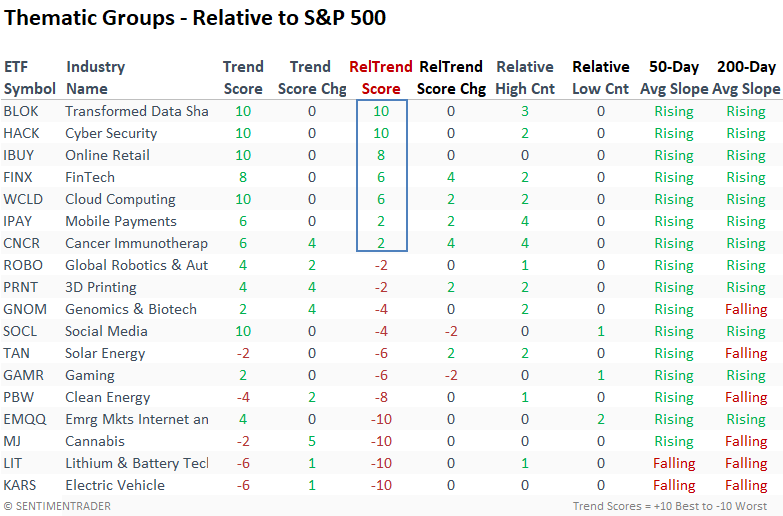
After a challenging year in 2022, thematic ETFs, particularly the Transformed Data ETF (BLOK) - a portfolio comprising stocks associated with the cryptocurrency ecosystem - and the cyber security ETF (HACK), have rebounded impressively, showing excellent absolute and relative trend scores.
Additionally, the GlobalX Fintech ETF (FINX), featuring several overlapping stocks with BLOK, is steadily climbing the ranks. However, we must be mindful that these ETFs/stocks have risen in anticipation of a potential approval of a spot Bitcoin ETF. So, a buy-the-rumor, sell-the-fact scenario could usher in a consolidation after a phenomenal run.
What the research tells us...
The market is overbought, and sentiment is optimistic, a condition typically associated with bull markets. After nine consecutive up weeks in the world's most benchmarked index, a consolidation to reset investor's expectations would not be surprising. Nothing goes up in a straight line. From a big-picture perspective, breadth and price trends across all market capitalizations and index construction methodologies look as good as they have since 2021. With that in mind, investors should maintain a buy-the-dip mentality until further notice.
If you'd like to see more frequent updates regarding my absolute and relative trend score rankings, please send an email to [email protected].
Absolute and Relative Trend Column Definitions
- Composite Trend Model - The CTM contains ten trend-following indicators to assess absolute price trends across several durations.
- Composite Trend Model Change - This indicator measures the 5-day net change in the composite trend model.
- Composite Relative Trend Model - The CRTM contains ten trend-following indicators to assess relative price trends vs. the S&P across several durations.
- Composite Relative Trend Model Change - This indicator measures the 5-day net change in the composite relative trend model.
- Relative High Count - This indicator measures the number of 21-day relative highs vs. the S&P 500 in the last five days.
- Relative Low Count - This indicator measures the number of 21-day relative lows vs. the S&P 500 in the last five days.
- 50-Day Average Slope - This indicator measures whether the 50-day moving average is increasing or decreasing.
- 200-Day Average Slope - This indicator measures whether the 200-day moving average is increasing or decreasing.
Please click here for a note with details on the construction of the composite trend model.