Products
SentimenTrader Trading Tools
‍
Backtest Engine
My Trading Toolkit
Correlation Analysis
Seasonality
Market Prediction
Indicators & Data API
‍
Proprietary Indicators & Charts
Market Data API
Strategies & Scanner
‍
50+ Trading Strategies
Smart Stock Scanner
Smart Option Scanner
Research Reports
‍
Research Solutions
Reports Library
Free Resources
Simple Backtest Calculator
Simple Seasonality Calculator
The Kelly Criterion Calculator
Sentiment Geo Map
Public Research Reports
Education
Sentiment Indicators
Technical Indicators
Pricing
Company
About
In the News
Testimonials
Client Success Stories
Contact
Log inLoginSign up
< BACK TO ALL REPORTS

More sector rotation and strong rallies on the other side of the world

Troy Bombardia
2020-11-10
Sector rotation continues as tech stocks significantly underperform for the first time in months. Meanwhile, Indian equities surged to all-time highs.

Sector rotation continues as tech stocks significantly underperform for the first time in months. Meanwhile, equities in India surged to all-time highs. 

After financial stocks languished for months, the vaccine news gave many financial stocks a much-needed jolt and pushed them above their upper Bollinger Bands.

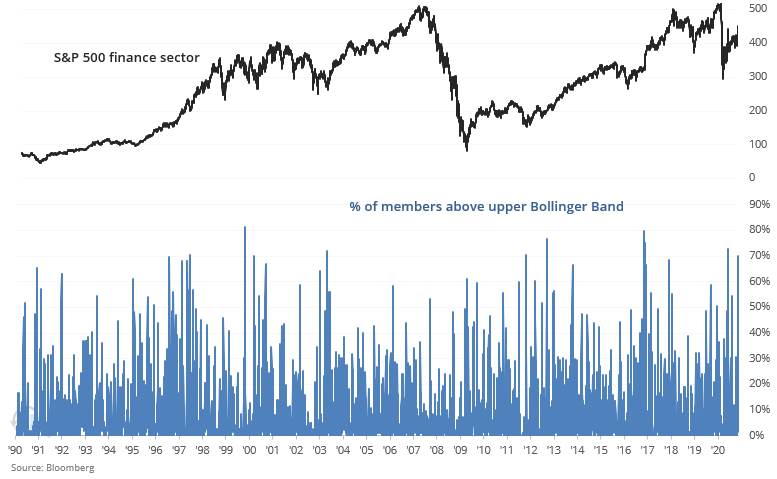
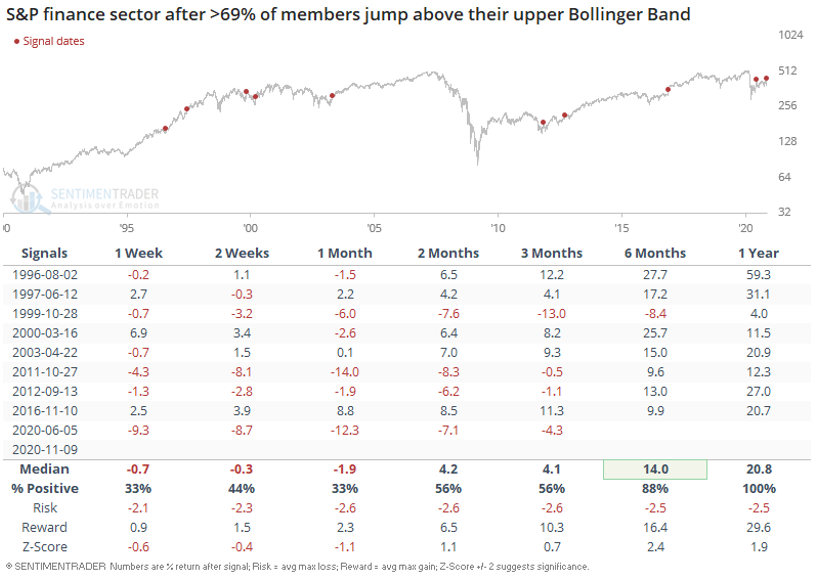
When so many financial stocks jumped, the S&P 500 financial sector usually performed poorly over the next few weeks. However, this was not a concern over the next 6-12 months:

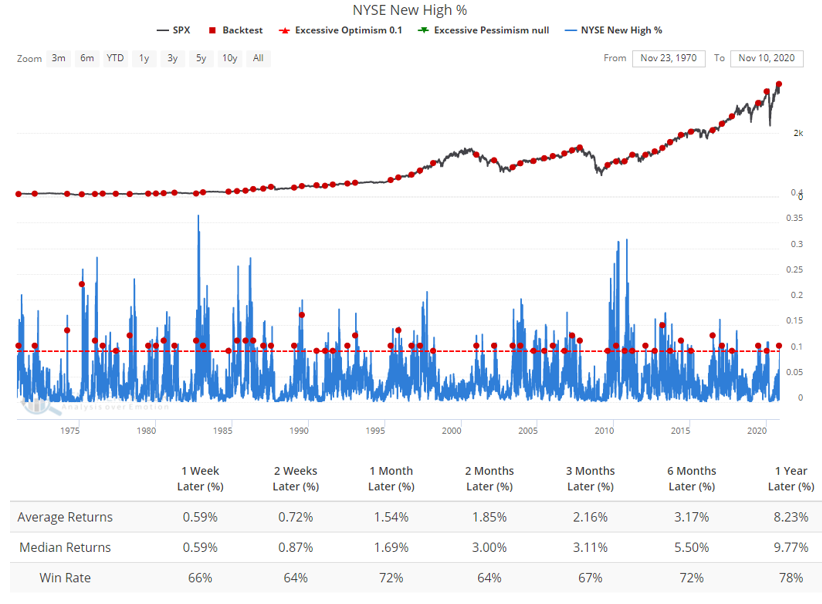
Thanks to sector rotation, Tuesday's surge pushed the % of NYSE members at a 52 week high to levels last reached before stocks crashed in March.

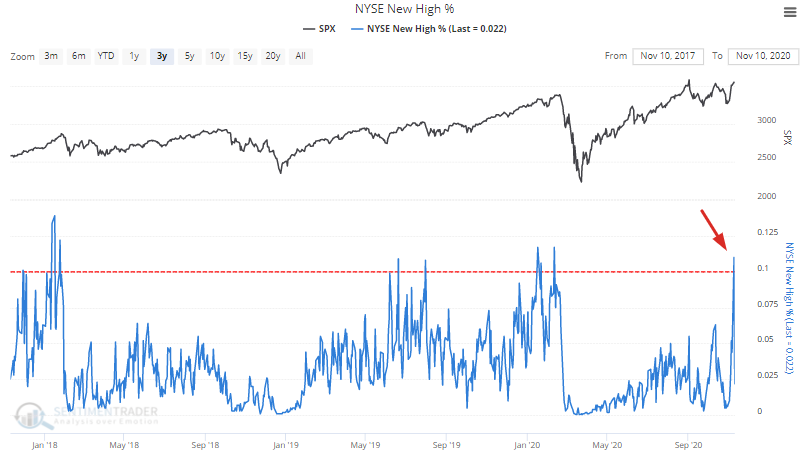
When this figured crossed above 10% for the first time in more than 6 months, the S&P 500's forward returns were mixed on every time frame:

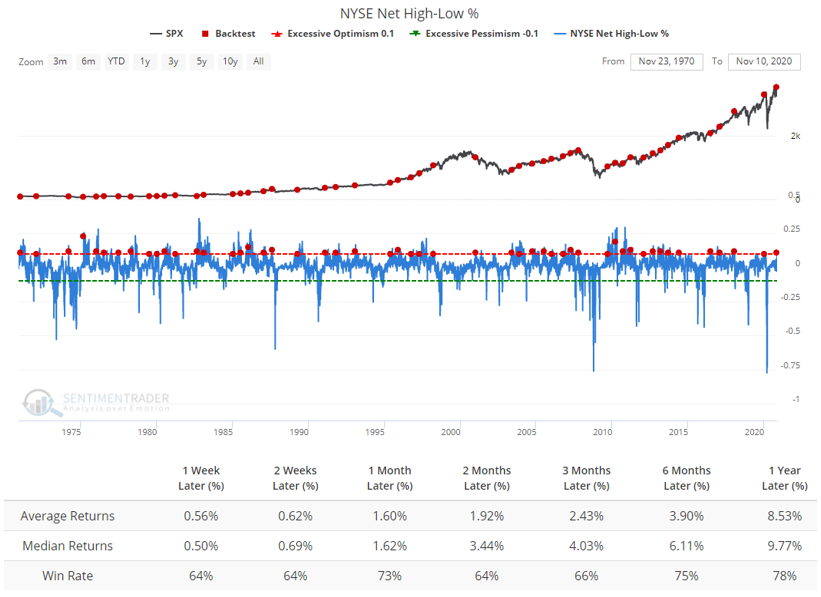
Similarly, the % of stocks at a 52 week high - % of stocks at a 52 week low jumped to the highest level since before stocks cratered in March:

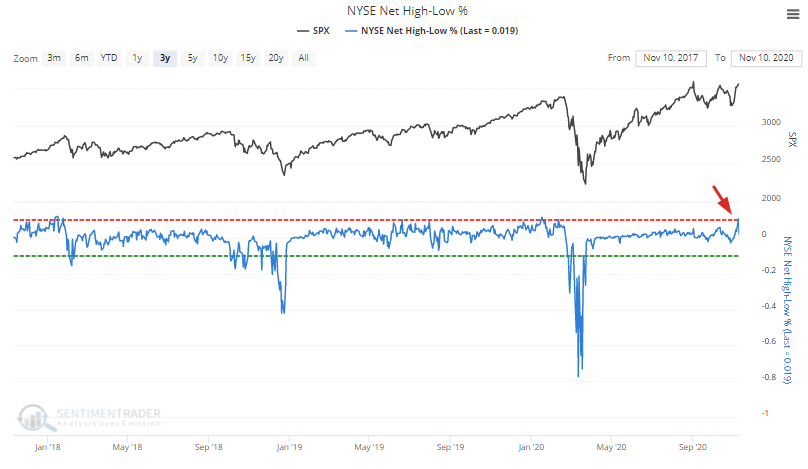
Once again, this led to mixed returns for the S&P 500 going forward:

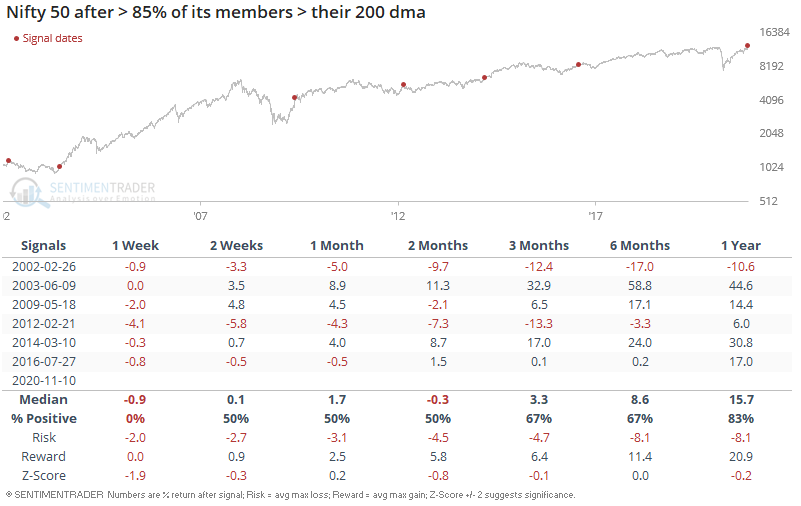
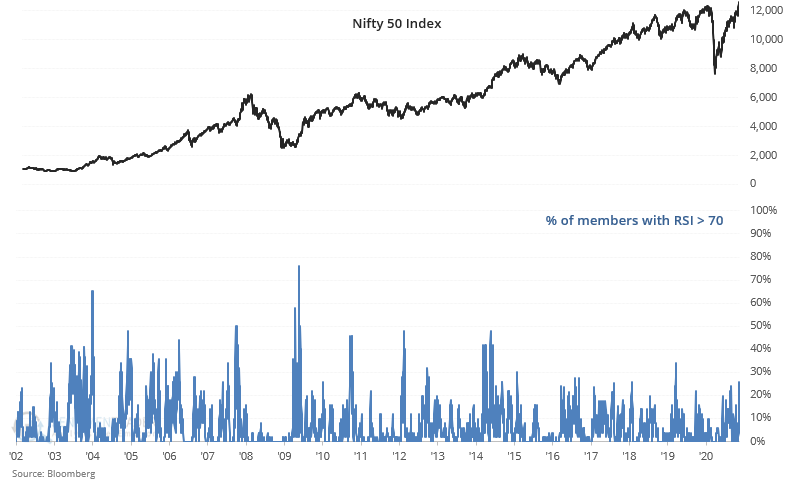
On the other side of the world, Indian equities are surging to all time highs. The % of Nifty 50 members above their 200 dma has surged to the highest level in almost 3 years:

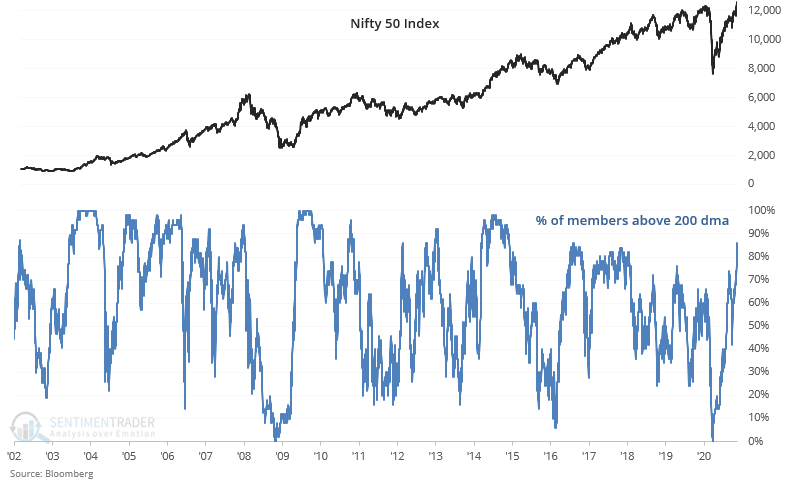
Such strong momentum usually saw Indian equities take a short term breather:

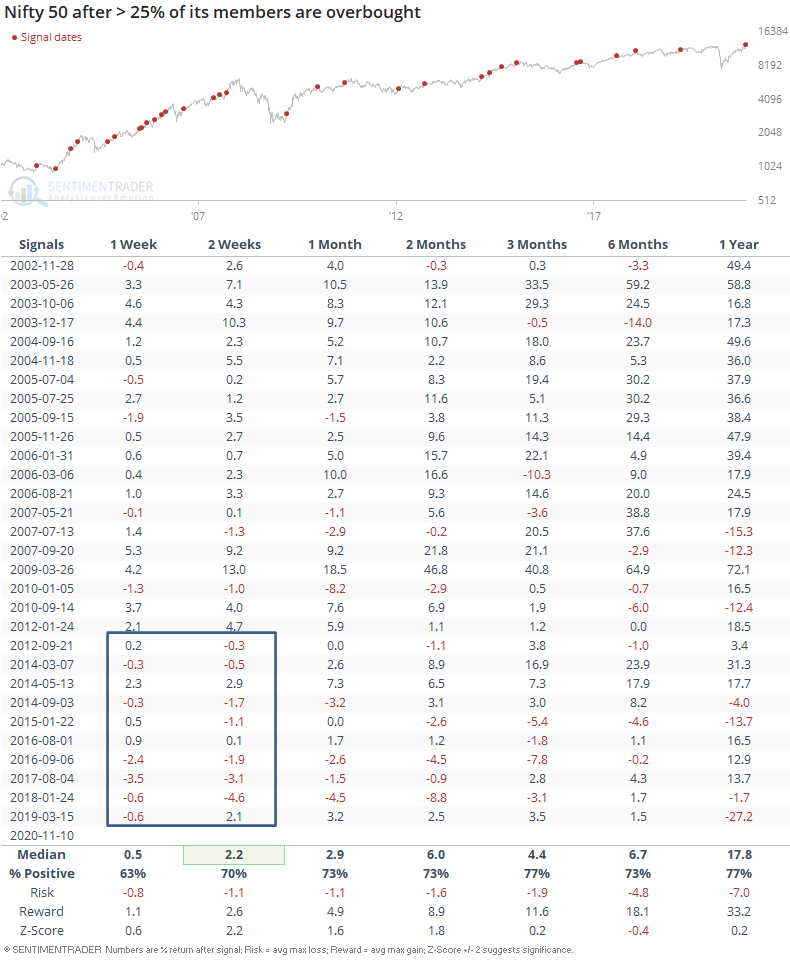
Looking at this from a different angle, the % of Nifty 50 members that are overbought surged to the highest level since March 2019:

The last 4 times this happened, Indian equities made a short term pullback. But beyond that, this was not a very effective bearish sign for the Nifty 50:

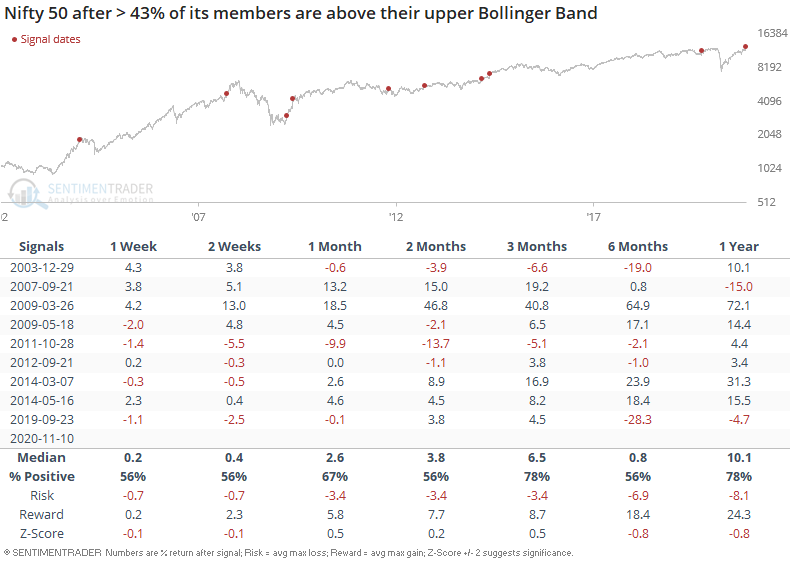
And finally, the % of Nifty 50 members above their upper Bollinger Band surged as well:

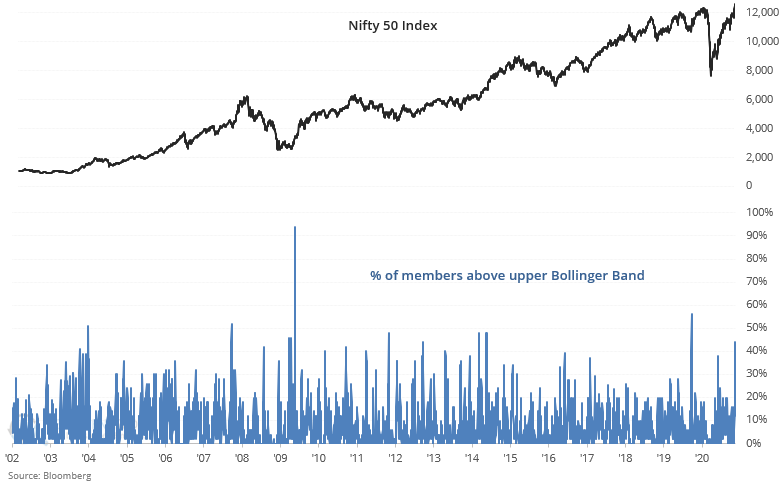
This mostly led to mixed returns for the Nifty 50 going forward:

PRODUCTS
SentimenTrader
Trading Tools
Indicators & Data API
‍
Strategies & Scanner
‍
Research Reports
FREE
RESOUrCES
Simple Backtest
Calculator
Simple Seasonality
Calculator
The Kelly Criterion
Calculator
Sentiment Geo Map
‍
Public Research Reports
‍
Education
Sentiment Indicators
‍
Technical Indicators
‍
Pricing
Bundle pricing
‍
FAQ
‍
Announcements
‍
COMPANY
‍
About
‍
In the News
‍
Testimonials
‍
Client Success Stories
CONTACT
‍
General Inquiries
‍
Media Inquiries
‍
Financial Professionals Inquiries
‍
© 2026 Sundial Capital Research Inc. All rights reserved.
Setsail Marketing
TermsPrivacyAffiliate Program
Risk Disclosure: The information and tools provided are for research and analytical purposes only and are not intended as investment advice. Market analysis involves uncertainty, and outcomes may differ from expectations. Users should conduct their own due diligence and consider their individual circumstances before making any financial decisions. Past performance is not necessarily indicative of future results.

Hypothetical Performance Disclosure: Hypothetical performance results have many inherent limitations, some of which are described below. No representation is being made that any account will or is likely to achieve profits or losses similar to those shown; in fact, there are frequently sharp differences between hypothetical performance results and the actual results subsequently achieved by any particular trading program. One of the limitations of hypothetical performance results is that they are generally prepared with the benefit of hindsight. In addition, hypothetical trading does not involve financial risk, and no hypothetical trading record can completely account for the impact of financial risk of actual trading. for example, the ability to withstand losses or to adhere to a particular trading program in spite of trading losses are material points which can also adversely affect actual trading results. There are numerous other factors related to the markets in general or to the implementation of any specific trading program which cannot be fully accounted for in the preparation of hypothetical performance results and all which can adversely affect trading results.

Testimonial Disclosure: Testimonials appearing on this website may not be representative of other clients or customers and is not a guarantee of future performance or success.