More seasonal trends for traders to consider

Key points
- Seasonality can be especially helpful in deciding when and where to allocate capital
- While seasonality offers clues, it is best applied in conjunction with confirming price action
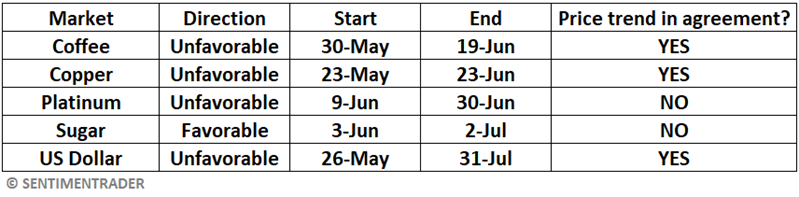
- Coffee, copper, platinum, and the US Dollar are all on the cusp of unfavorable seasonal periods, while sugar is about to enter a favorable period
Coffee enters a weak period after a parabolic run
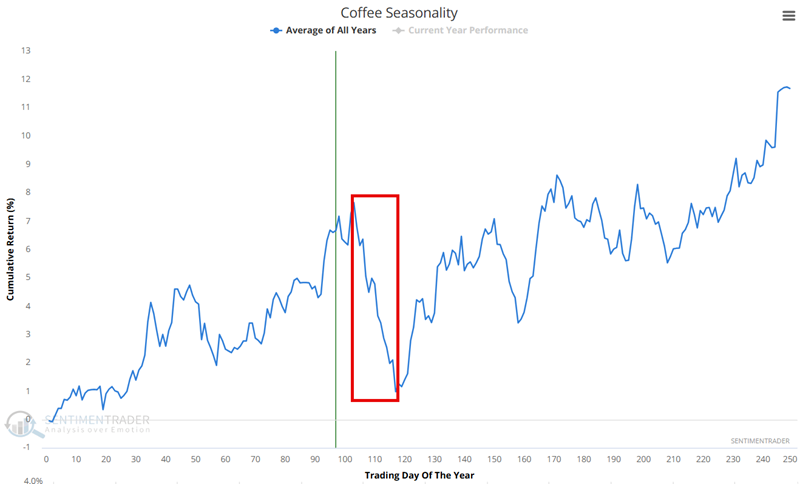
The Annual Seasonal Trend chart below for Coffee futures shows an unfavorable period that extends from the close of Trading Day of the Year (TDY) #103 through TDY #117. For 2025, this period extends from the close on 2025-05-30 through 2025-06-19.
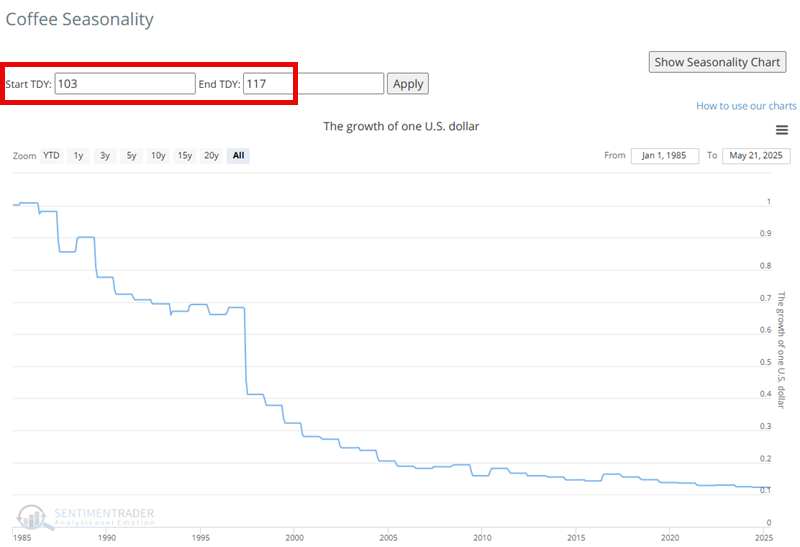
The chart below displays the hypothetical growth of $1 invested in coffee only during this period, every year since 1985.
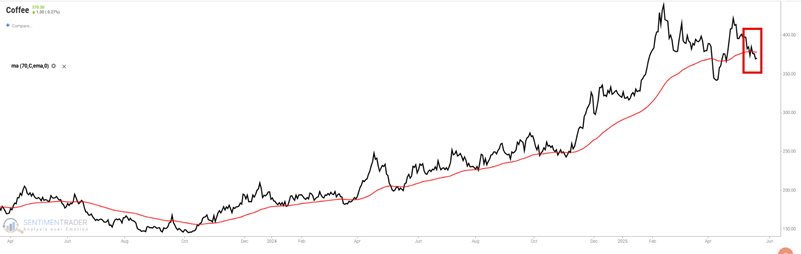
Coffee is coming off a parabolic run to new all-time highs and a massive spike in trader optimism. The chart below displays coffee versus the 100-day moving average for our Coffee Optix indicator. As always, history in the market never guarantees anything in the future. Nevertheless, the history of coffee price action following similar occurrences suggests the potential for significant downside.
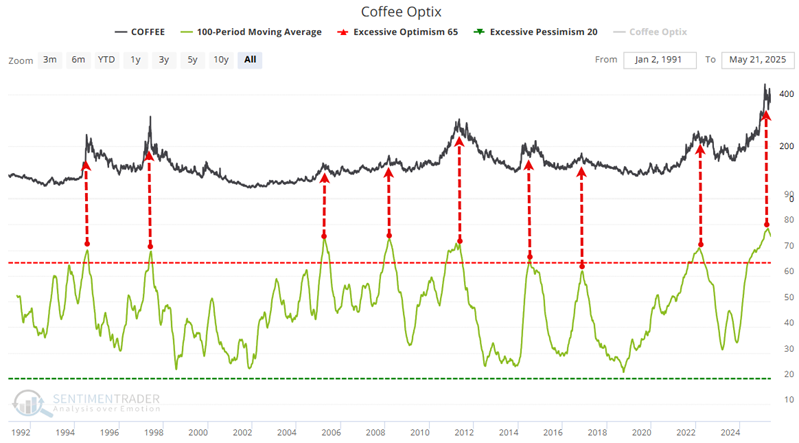
Let's also note that price action recently slipped below the 70-day EMA.
An unfavorable period for copper
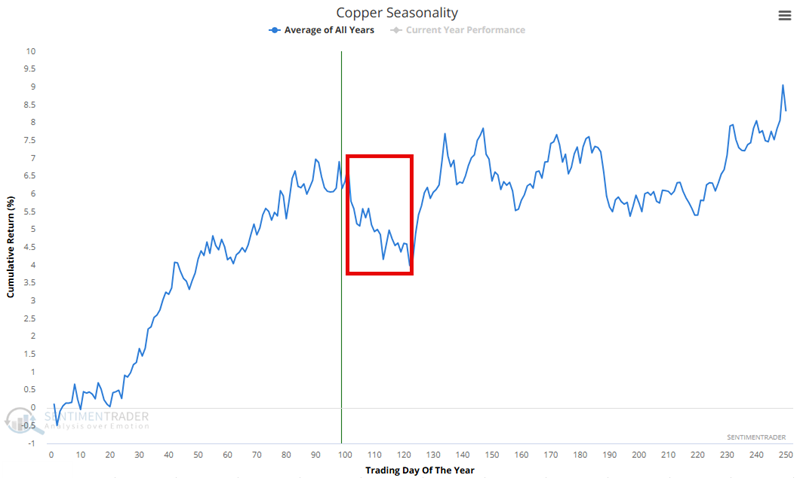
Copper had a terrific run into late March 2025, but has been floundering and consolidating ever since. The Annual Seasonal Trend chart below for copper reveals it is entering a typically challenging period that extends from the close of Trading Day of the Year (TDY) #101 through TDY #122. For 2025, this period extends from the close on 2025-05-23 through 2025-06-23.
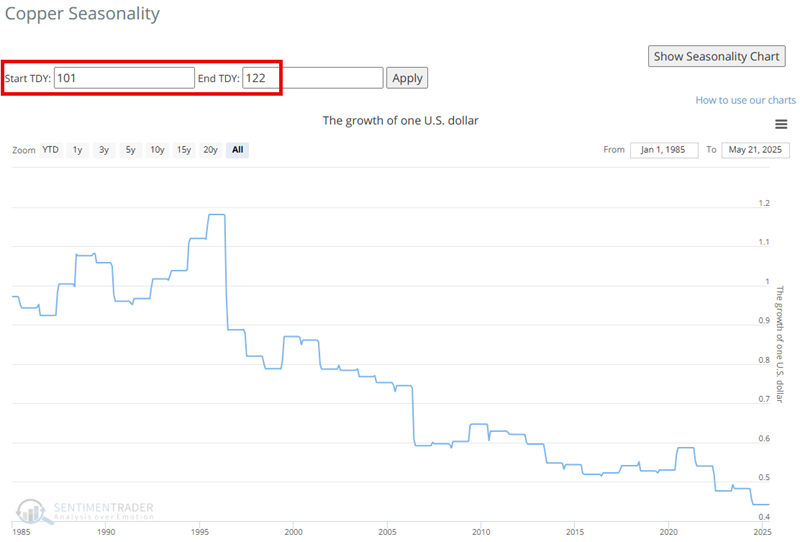
The chart below displays the hypothetical growth of $1 invested in copper only during this period every year since 1985.
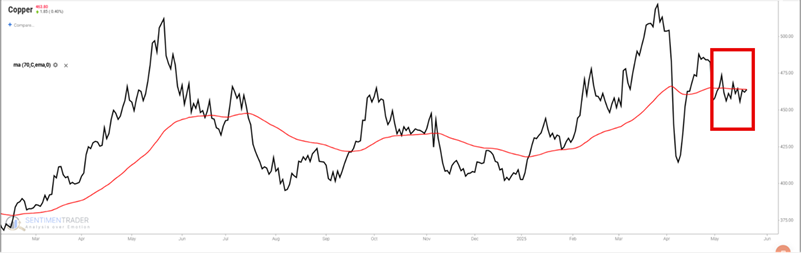
Traders might consider shorting copper during the above dates, particularly if price action holds below the 70-day EMA.
Platinum has spiked, but traders might do well to remain wary
The Annual Seasonal Trend chart below for platinum shows an impending unfavorable seasonal window in the weeks ahead. This period extends from the close of Trading Day of the Year (TDY) #113 through TDY #128. For 2025, this period extends from the close on 2025-06-09 through 2025-06-30.
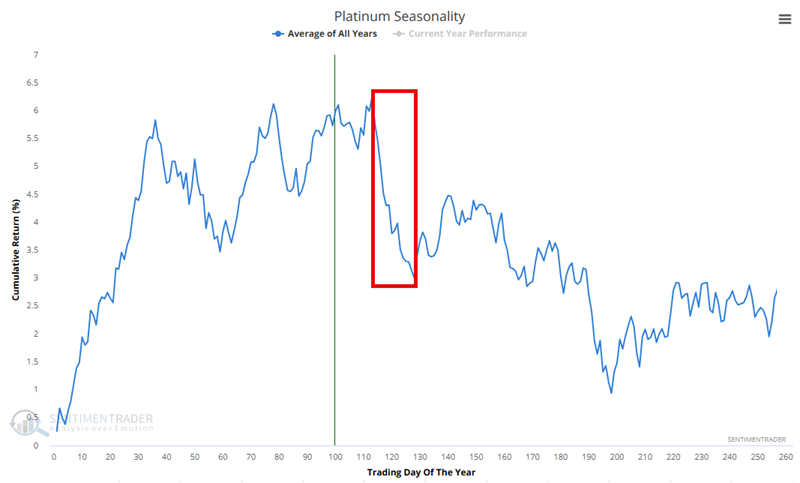
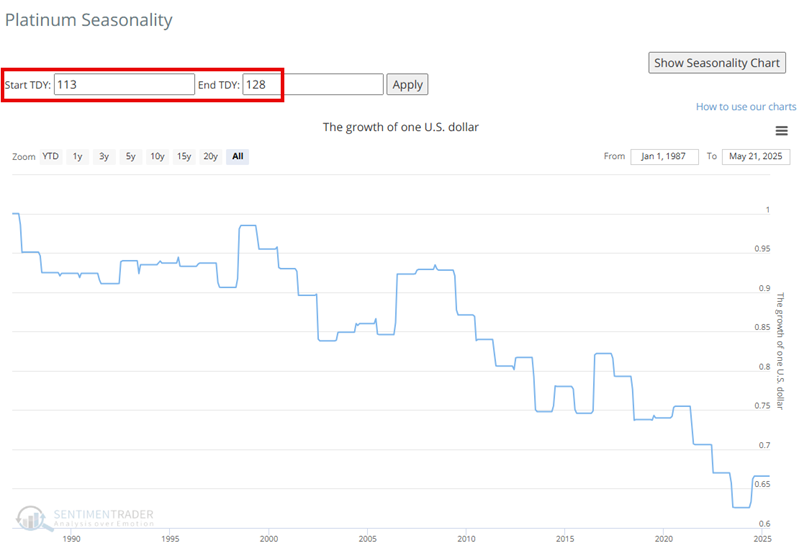
The chart below displays the hypothetical growth of $1 invested in platinum only during this period every year since 1985.
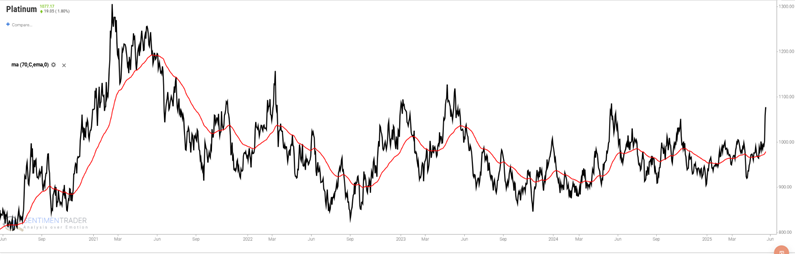
The chart below shows that price action recently experienced an impressive spike and that platinum is presently well above its 70-day EMA (i.e., objectively in an uptrend). Despite this spike, a lot of overhead resistance remains for platinum. Traders should pay close attention to the price trend as June 9th approaches for a potential opportunity to play the short side.
Sugar closes in on a favorable period
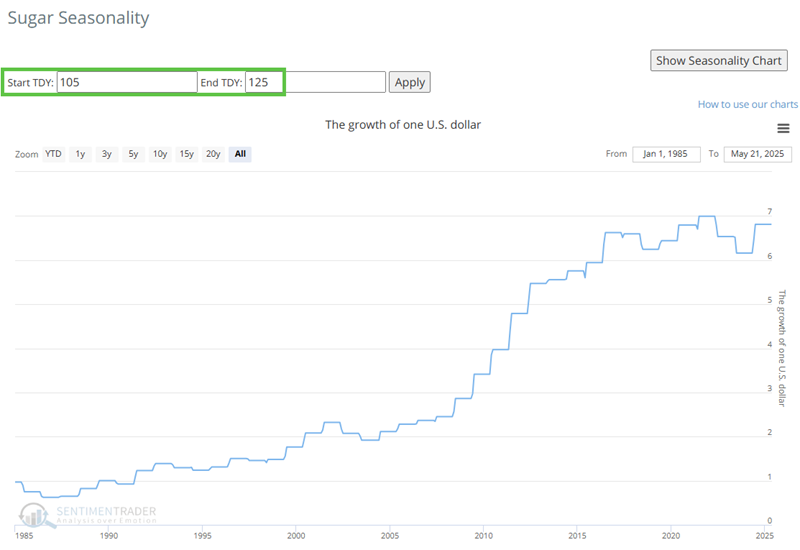
The Annual Seasonal Trend chart below for Sugar shows an impending favorable seasonal window that extends from the close of Trading Day of the Year (TDY) #105 through TDY #125. For 2025, this period extends from the close on 2025-06-03 through 2025-07-02.
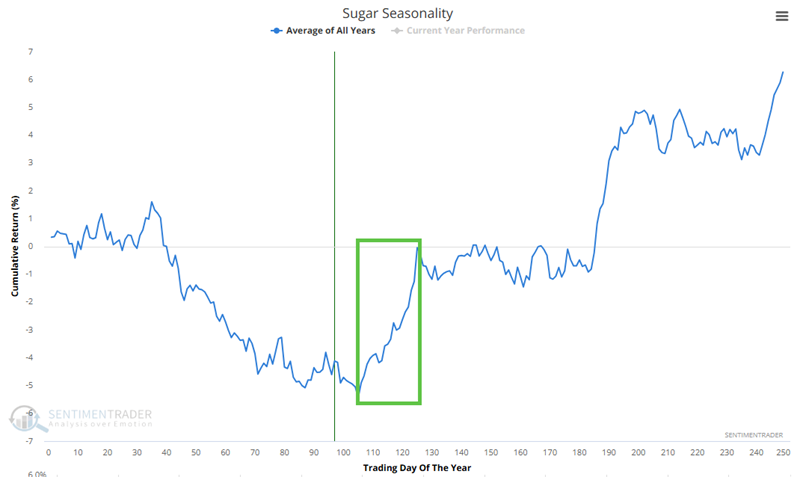
The chart below displays the hypothetical growth of $1 invested in sugar only during this period, every year since 1985.
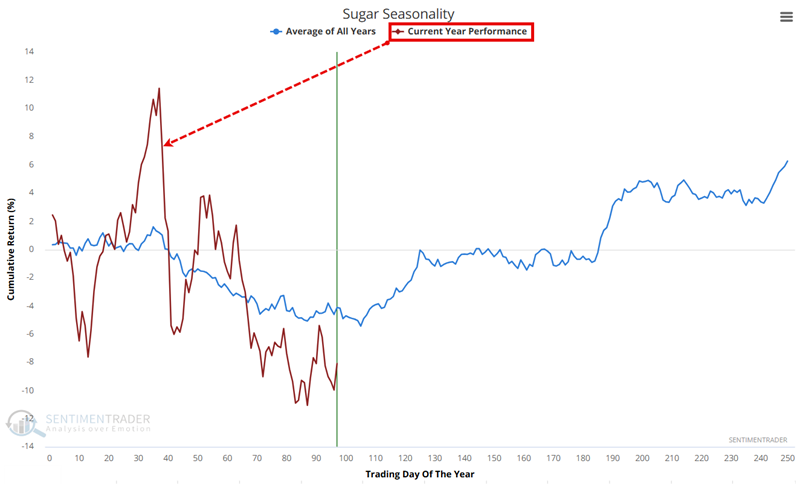
Two things to note: First, sugar has tracked its Annual Seasonal Trend closely in 2025.
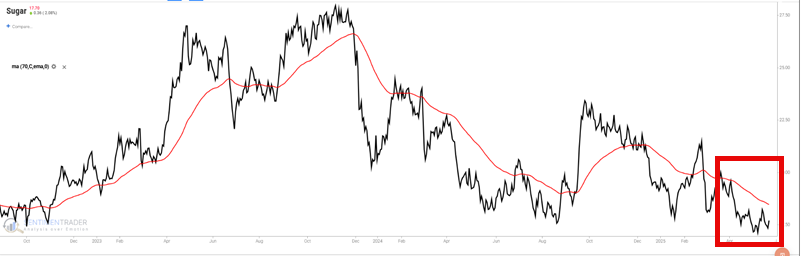
However, price action is presently unfavorable, with sugar trading below its 70-day EMA. Some firming of price action would bolster confidence in taking a long position in this market.
Note that non-futures traders can play the long side of the sugar market by buying shares of the Teucrium Sugar Fund (CANE) just as they would buy shares of stock.
Trouble still looms for the US Dollar
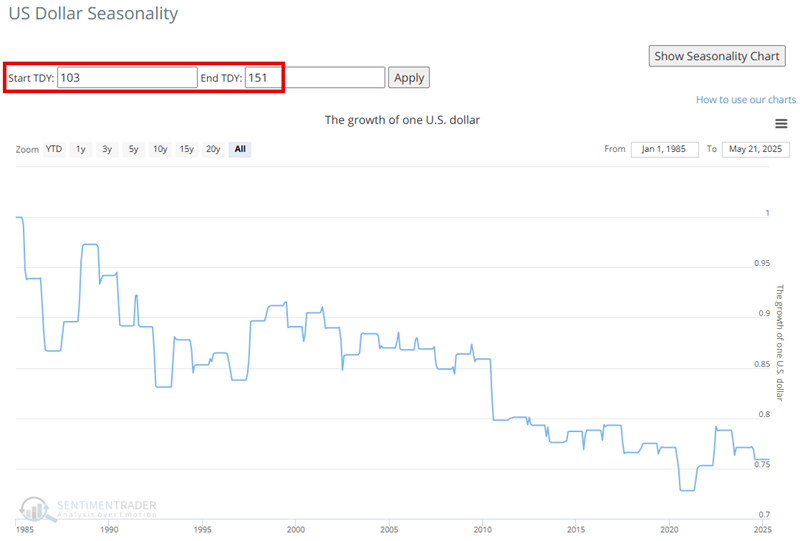
The Annual Seasonal Trend chart below for the US Dollar shows an unfavorable period that extends from the close of Trading Day of the Year (TDY) #103 through TDY #151. For 2025, this period extends from the close on 2025-05-26 through 2025-07-31.
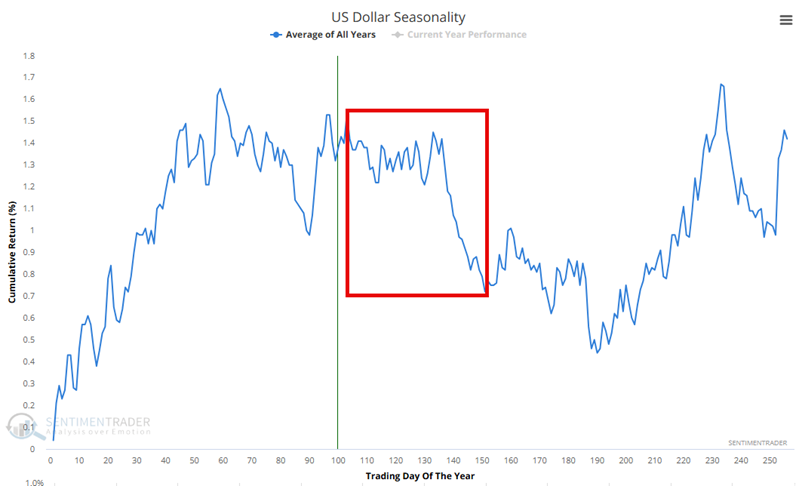
The chart below displays the hypothetical growth of $1 invested in the US Dollar only during this period, every year since 1985.
The US Dollar is presently in an established downtrend, trading below its 70-day EMA. Remember, when using seasonality, we prefer to see seasonal and price trends in agreement.
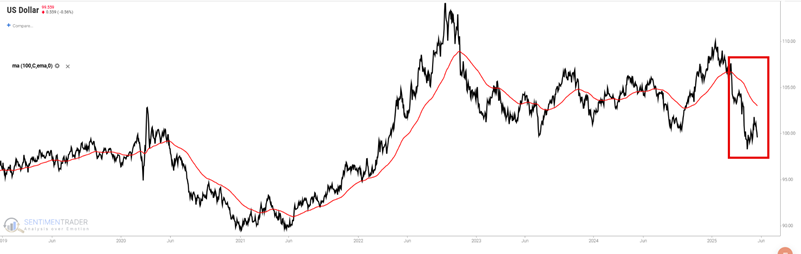
Non-futures traders can play the short side of the US Dollar by buying shares of the Invesco DB US Dollar Index Bearish Fund (ticker UDN), which trends inversely to the US Dollar.
What the research tells us…
Seasonality is merely a summation of the past, NOT a roadmap to the future. Per Michael Santoli's famous quote, "Seasonality is climate, not weather." For my purposes, I use seasonality as a tool to tell me "when to look where." At the moment, and in the weeks ahead, I will look for opportunities to play the long side of sugar and the short side of coffee, copper, platinum, and the US Dollar.