More seasonal trading opportunities to consider

Key points
- Seasonality can be especially helpful in deciding when and where to allocate capital
- The health care sector and natural gas are entering favorable seasonal periods
- Meanwhile, copper miners, homebuilders, Japanese stocks, and the transportation sector are entering unfavorable seasonal periods
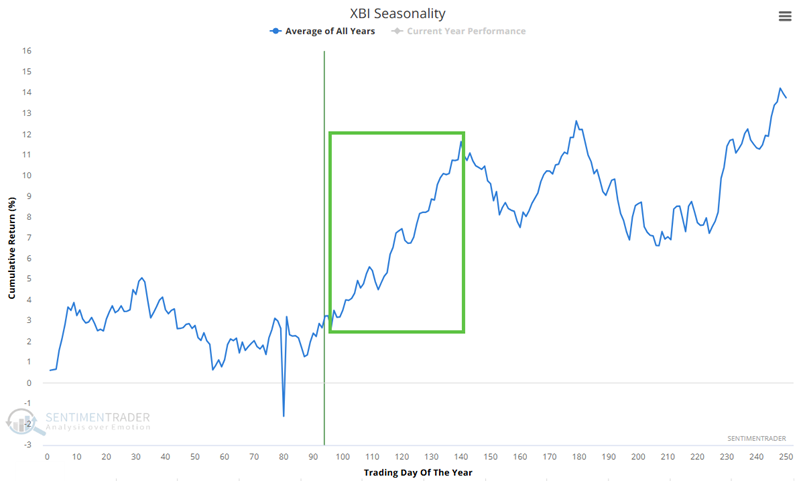
Biotech enters the seasonal sweet spot
The Annual Seasonal Trend chart below for the SPDR S&P Biotech ETF (XBI) shows a favorable period that extends from the close of Trading Day of the Year (TDY) #96 through TDY #140. For 2025, this period extends from the close on 2025-05-21 through 2025-07-25.
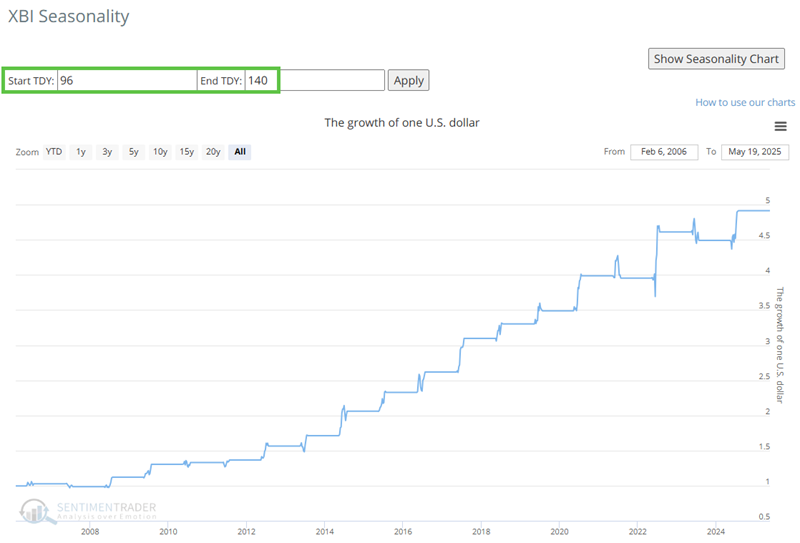
The chart below displays the hypothetical growth of $1 invested in XLB only during this period, every year since 2006
Currently, XBI's price action does not agree with a favorable seasonal trend. The chart below shows that the bullish case would strengthen if XBI could move back above its 70-day EMA.
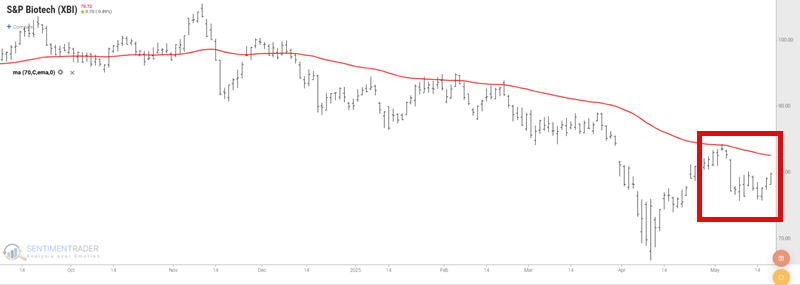
For the record, there is nothing "magical" about a 70-day EMA. However, it tends to be a helpful filter for designating price action to agree or disagree with seasonality. Ideally, a trader will consider a bullish position if seasonality and price action are both favorable, and/or a bearish position if seasonality and price action are both unfavorable.
A favorable time for real estate approaches
The real estate sector has been trending sideways for two and a half years. Could it be in line for a surprise rally? We can't predict. Nevertheless, we can note that the Annual Seasonal Trend chart below for the iShares U.S. Real Estate ETF (IYR) shows a favorable period that extends from the close of Trading Day of the Year (TDY) #98 through TDY #146. For 2025, this period extends from the close on 2025-05-23 through 2025-08-04.
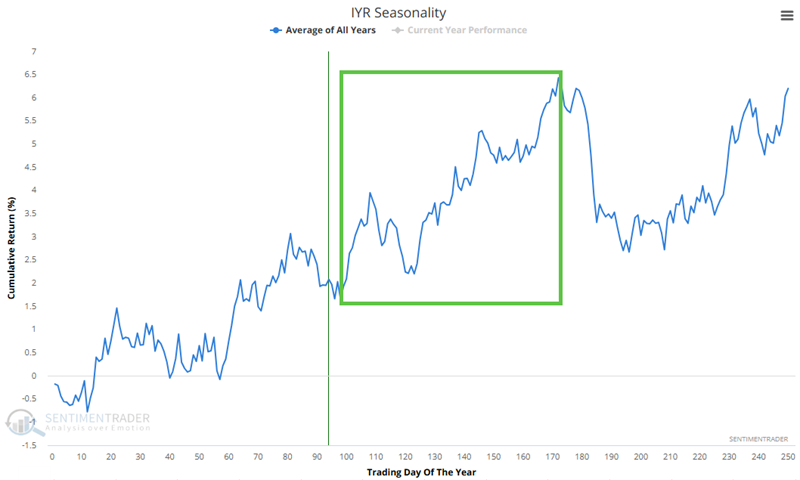
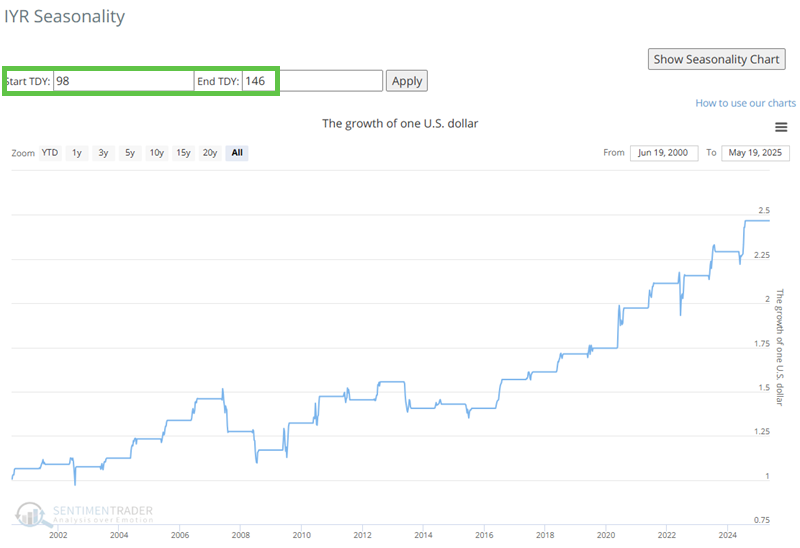
The chart below displays the hypothetical growth of $1 invested in IYR only during this period, every year since 2000.
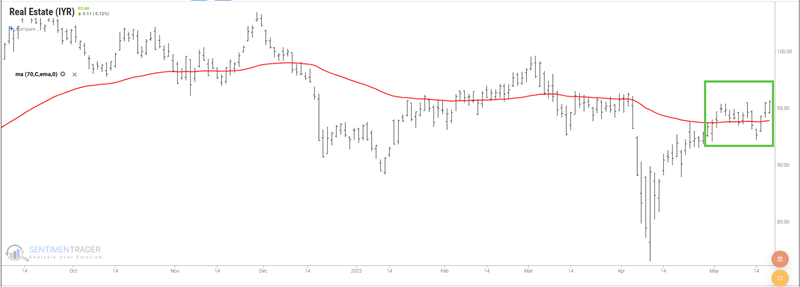
Price action has improved for IYR as shown in the chart below.
A short favorable window for the broader market
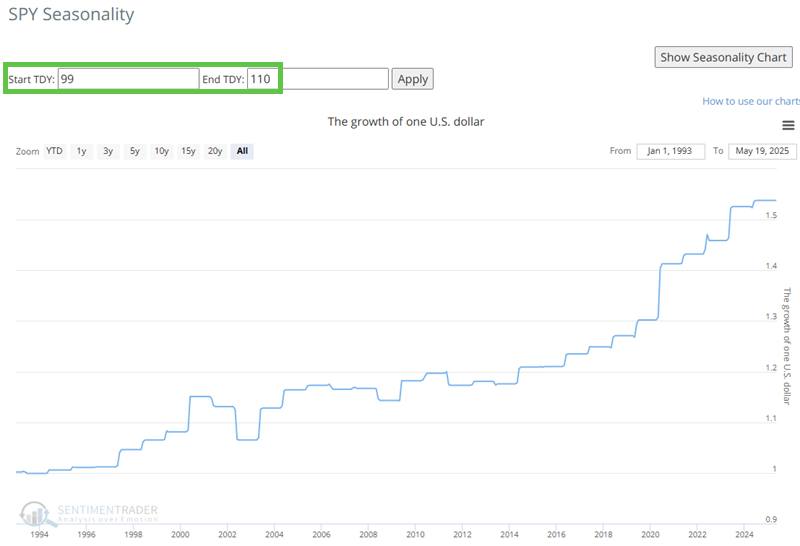
The Annual Seasonal Trend chart below for the SPDR S&P 500 Trust (SPY) shows a short favorable seasonal window in the weeks ahead. This period extends from the close of Trading Day of the Year (TDY) #99 through TDY #110. For 2025, this period extends from the close on 2025-05-27 through 2025-06-11.
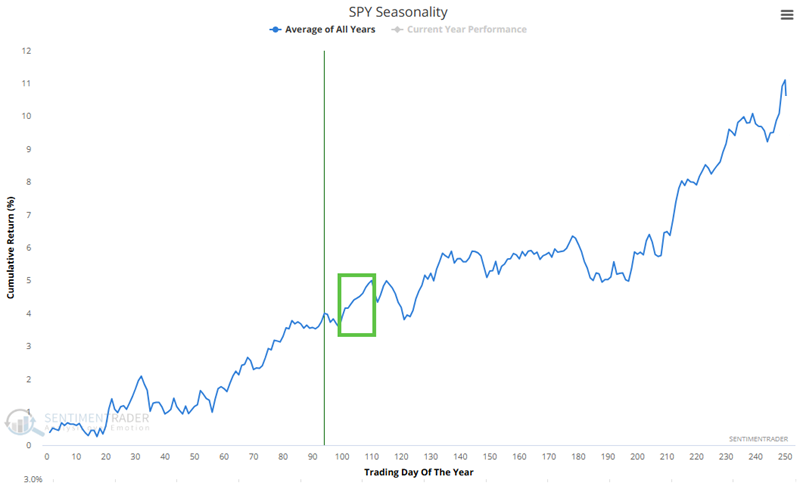
The chart below displays the hypothetical growth of $1 invested in SPY only during this period every year since 1993.
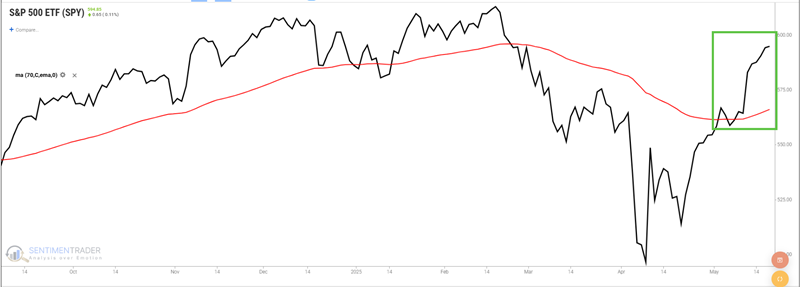
The chart below shows that price action can be deemed favorable for SPY.
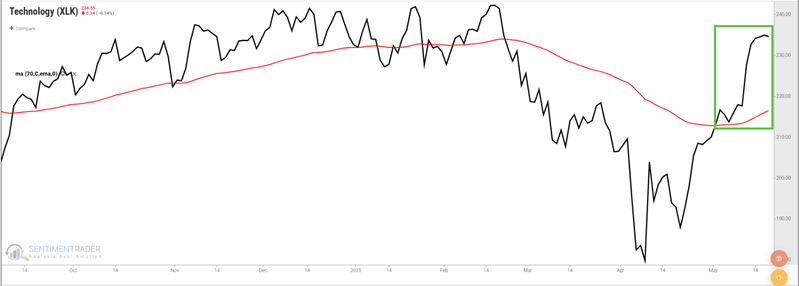
Technology says, "We're not dead yet"
Many pundits argued that the run in technology stocks was overdone and had run its course. Some invoked concerns of a 2000-like top. The jury is still out on whether they are correct. But for now, seasonality and price action are again on the verge of aligning on the favorable side of the ledger.
The Annual Seasonal Trend chart below for the SPDR S&P Technology ETF (XLK) shows an impending favorable seasonal window. This period extends from the close of Trading Day of the Year (TDY) #99 through TDY #135. For 2025, this period extends from the close on 2025-05-27 through 2025-07-18.
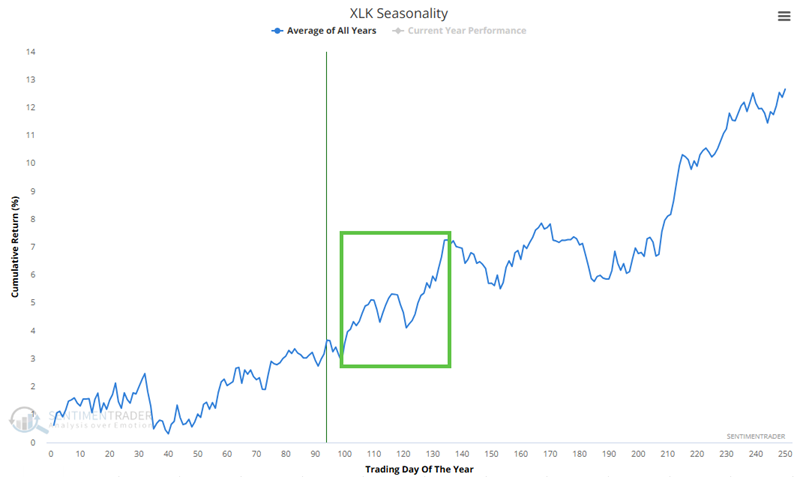
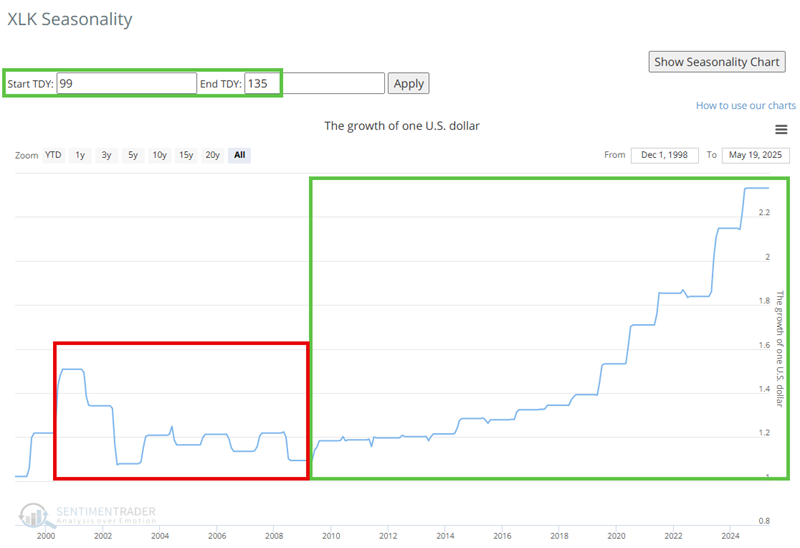
The chart below displays the hypothetical growth of $1 invested in XLK only during this period, every year since 1999. It is fair to note the significant declines in 2001 and 2002 and the sideways action into 2009. Since then, XLK has shown a gain during this period in 14 of the past 16 years.
The chart below shows that price action can be deemed favorable for XLK.
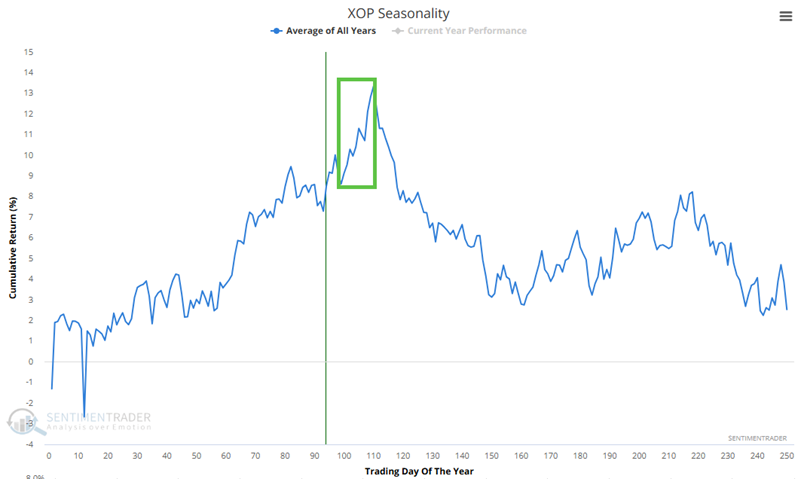
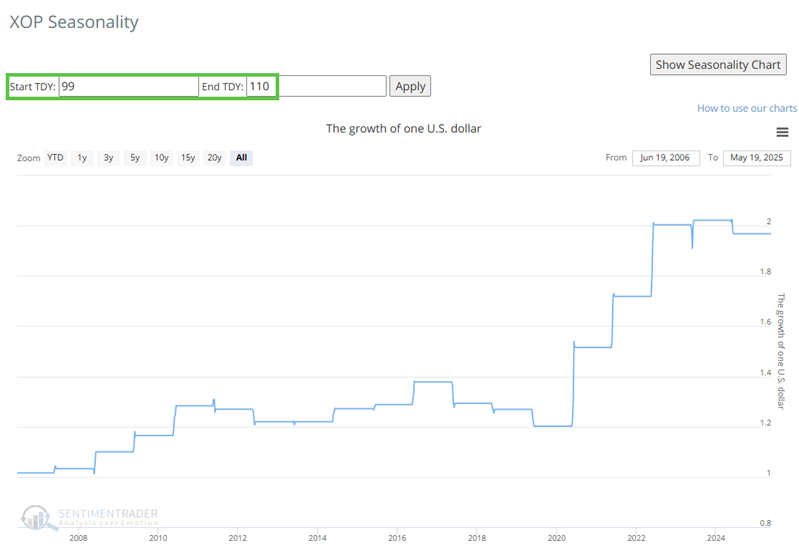
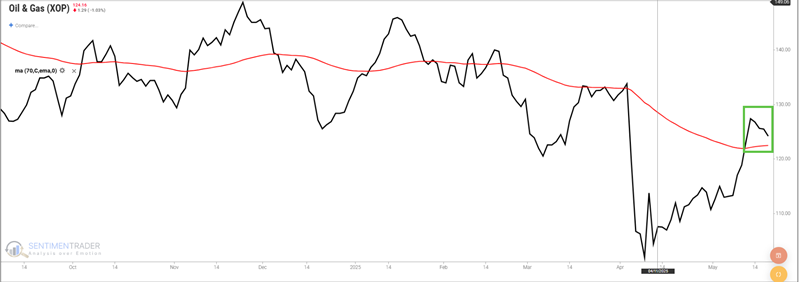
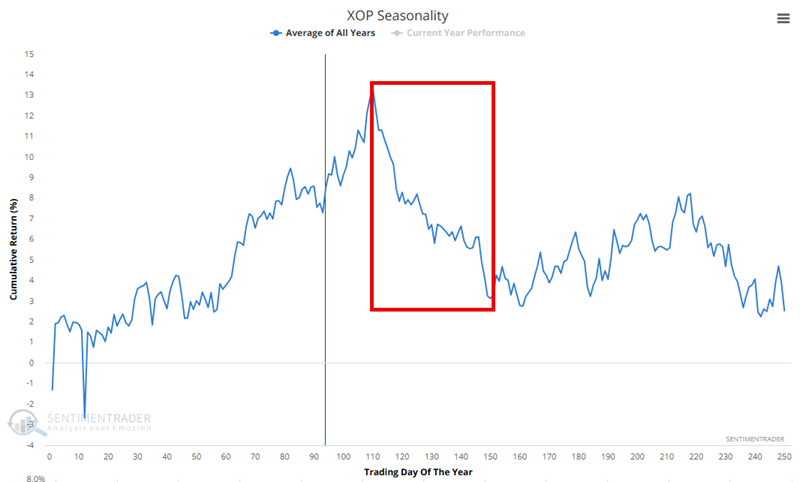
A "last gasp" for energy - and then the potential for trouble
The Annual Seasonal Trend chart below for the SPDR S&P Oil & Gas Exploration & Production ETF (XOP) shows a favorable period that extends from the close of Trading Day of the Year (TDY) #99 through TDY #110. For 2025, this period extends from the close on 2025-05-27 through 2025-06-11.
The chart below displays the hypothetical growth of $1 invested in XOP only during this period, every year since 2007.
Price action for XOP recently poked its head into favorable territory
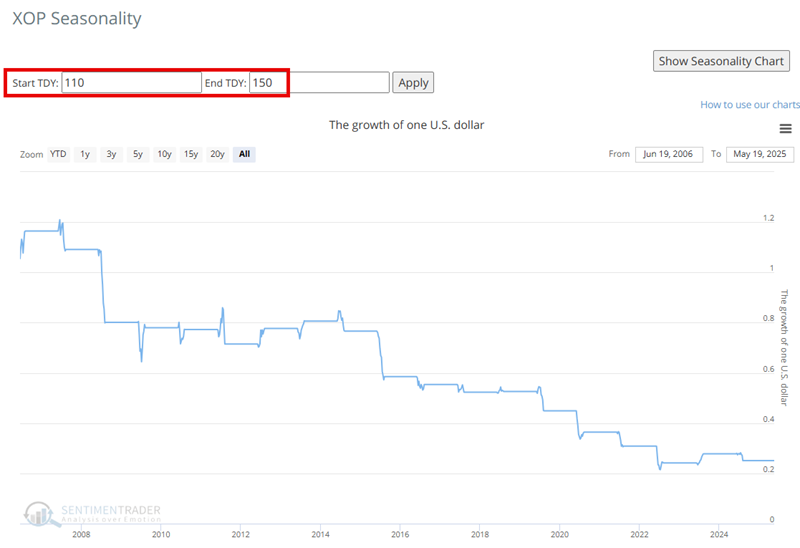
The bad news for energy is that seasonality immediately turns unfavorable following TDY #110. The chart below highlights the period of TDY #110 through TDY #150. For 2025, this period extends from the close on 2025-05-27 through 2025-06-11.
The chart below displays the hypothetical growth of $1 invested in XBI from TDY 110 through TDY 150 each year since 2007.
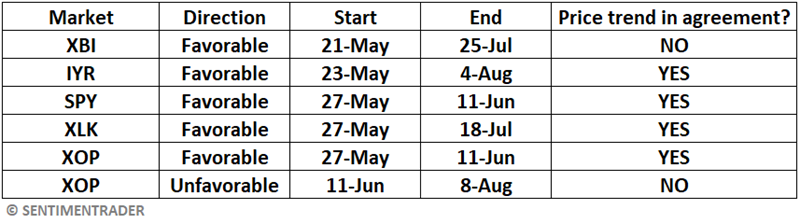
What the research tells us…
Seasonality is merely a summation of the past, NOT a roadmap to the future. Per Michael Santoli's famous quote, "Seasonality is climate, not weather." For my purposes, I use seasonality to tell me "when to look where." I also tend to prefer to pursue opportunities where price and seasonal trends agree. The table below summarizes the details above, showing the market, the seasonal direction and dates, and whether or not the price is presently in agreement with the impending seasonal trend.