
More Put/Call Indicators Flashing Favorable Signs

Key points:
- Put/Call option-related indicators help gauge and identify extremes in trader sentiment
- That said, they should rarely be used as the sole basis for buy or sell decisions; likewise, one-off readings are less reliable than sustained readings. Nevertheless, a confluence of similar put/call signals can lend considerable favorable weight to the bullish case
- A few more put/call indicators have flashed ostensibly favorable signals recently
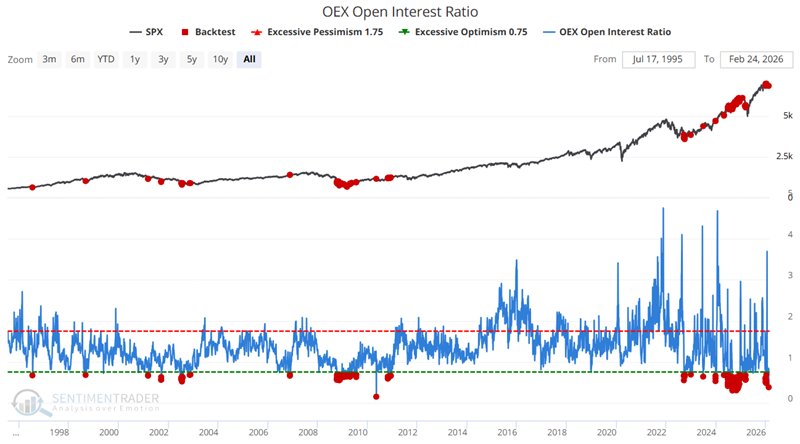
Indicator #1: OEX Open Interest Ratio
OEX is shorthand for the S&P 100, an index made up of the 100 largest companies in the S&P 500. Open interest is the total number of outstanding option contracts. Open interest increases with opening transactions and decreases with closing transactions. Someone buying a call to open (a bullish position) would increase open interest by one, and someone selling a call to open (a bearish position) would also increase open interest by one. The open interest indicator divides the total put open interest by the total call open interest. As more put contracts are opened (and/or call contracts are closed), the indicator rises; as put contracts are closed (and/or call contracts are opened), the indicator falls.
The OEX put/call open interest ratio should be considered in a non-contrarian manner. As put open interest rises in relation to call open interest, it suggests that OEX option traders - usually quite successful at identifying market turning points - are accumulating put positions. This is a bearish development. Conversely, if OEX traders are accumulating call positions, then the put/call open interest ratio should fall, which is usually a bullish development.
The chart below highlights all dates when the indicator was below 0.70. The most recent signals occurred on February 23rd and 24th.
The table below summarizes the subsequent performance of the S&P 500 Index.
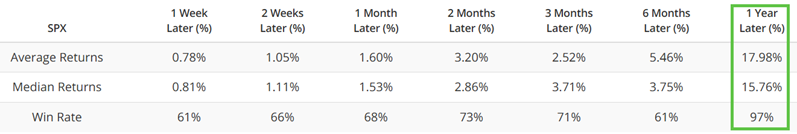
Win Rates and Median Returns over the first six months following a signal are only so-so. However, the 1-year results have been solid. This is one more reason why we should not view the recent signals as outright "buy" signals, but rather as favorable weight of the evidence for investors with at least a one-year timeframe.
To refine things a bit, the test below highlights only when the OEX Open Interest Ratio was below 0.70 for the first time in a year. The most recent signal was on February 23rd.
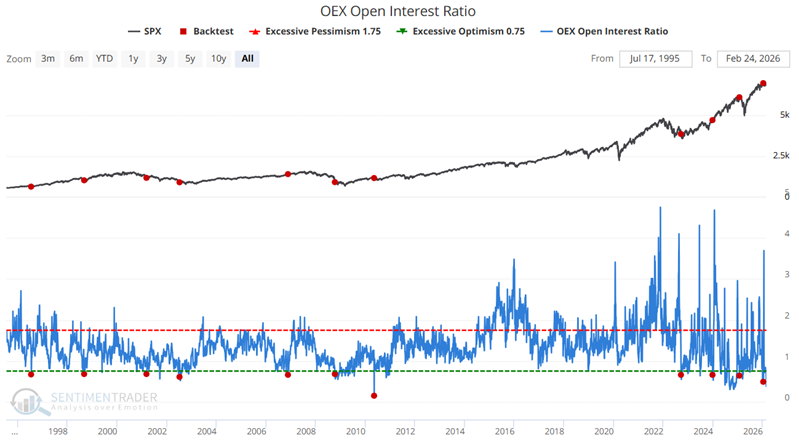
The table below displays signal-by-signal S&P 500 performance and summarizes those results.

Once again, let's be clear about what historical results do and do not say. 1 Year returns are notably well above average. But getting there has been far from "smooth sailing." One more word on using put/call indicators as something more than weight of the evidence: In the table above, the 1-year results are outstanding - a 90% Win Rate and a Median Return of 15.23%. However, this belies the volatility an investor would have endured to generate those returns had they used this signal as an outright "Buy" signal for the S&P 500 Index. The table below highlights the maximum percentage decline from the entry price that occurred within the one year after each signal.
Note that 7 of the 11 signals displayed in the tables above and below saw the S&P 500 decline at least -9.4% at some point in the next 12 months.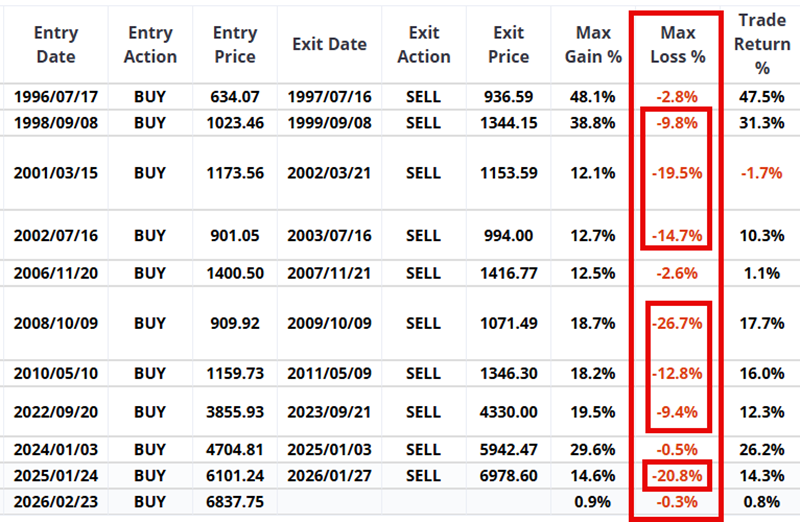
The bottom line: Historical results for the signal detailed above suggest that the S&P 500 Index will be higher 12 months from now. That's the good news. The bad news is that it says nothing about the amount of downside volatility investors might expect between now and then.
Indicator #2: ROBO Put/Call Ratio
ROBO is an acronym we coined for Retail-Only, Buy-to-Open.
This ratio focuses on small traders to better understand what they're trying to do. When looking at put/call information, it is most helpful to see whether volume is going into opening or closing transactions, as this indicates how aggressive traders are betting on a market move. Also, especially for very small traders, buying options to open is more telling than selling options to open.
A small trader buys a call option to open a position for one reason: he thinks his stock is going higher. He buys a put option to open because he thinks his stock is going down. You may argue that he's hedging an underlying stock position, but it doesn't matter. If he thinks his stock is going up, he's not going to buy a put just for the thrill of it.
If we isolate trades to those of 10 contracts or fewer and further restrict them to buys and opening transactions only, we can get an accurate picture of what retail traders (i.e., small brokerage firm customers) are doing. This ratio considers only buy-to-open transactions for trades of 10 or fewer contracts. Therefore, it is an excellent read on the emotions of the smallest of traders and should be interpreted in a contrary manner.
When the ROBO put/call ratio is high, it means small traders are buying many puts relative to calls, suggesting they believe their stocks will decline. This is bullish for the market once it reaches an extreme. On the other hand, when these traders are so confident in their stocks that the ROBO ratio drops to a low level, we need to be aware that sentiment is becoming too frothy, and a market decline may soon be at hand.
We have found that signals from this indicator are more reliable when they occur within a larger uptrend. In other words, we want to look for a pullback in an uptrend ("Buy the dip"). The chart below highlights the dates when the ROBO Put/Call Ratio exceeded 0.75 while the S&P 500 Index was above its 50-day moving average. The most recent signal occurred on February 20th.
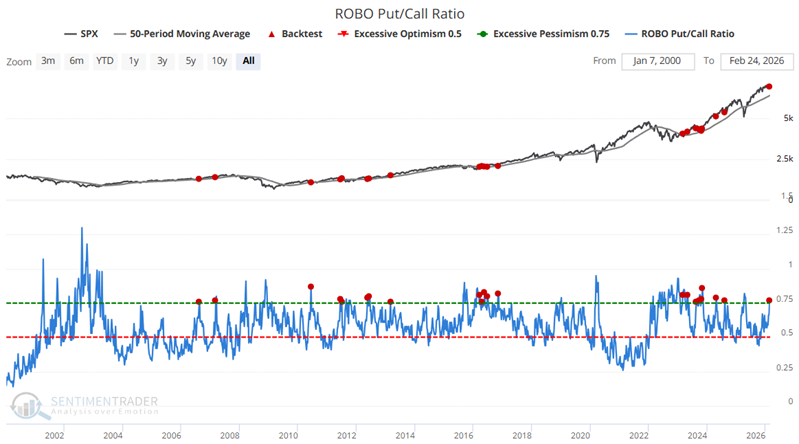
The table below summarizes subsequent S&P 500 results.
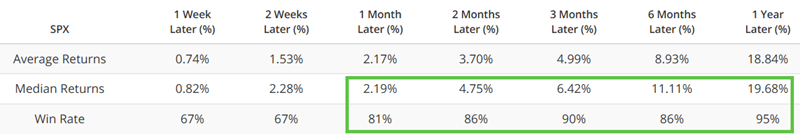
Note the well-above-average Win Rates and Median Returns across all timeframes.
What the research tells us…
Put/call ratio indicators offer a snapshot of the prevailing sentiment of active (typically short-term) traders. As this type of trading is often driven by emotion, extremes in behavior usually yield useful contrarian signals. The data highlighted above and in this recent note suggest that short-term traders are extremely skittish and are more concerned about downside risk than upside potential. This abundance of doubt and/or fear lends contrarian weight to the favorable side of the weight of the evidence ledger.