
More on Confidence indicators

Key points
- Recent notes have highlighted notable developments in consumer confidence (see here and here)
- Like all sentiment indicators, consumer confidence indices typically flash a meaningful alert when they reach an extreme
- From a trading perspective, however, the time to be prepared to act is when these indexes reach an extreme and then reverse
Conference Board - Stocks reverses from a low
The Conference Board surveys investors and creates two categories: those who expect stocks to rise and those who expect stocks to fall. The "Conference Board-Stocks" index shows the net percentage of consumers expecting stocks to increase minus the net percentage of consumers expecting stocks to decrease.
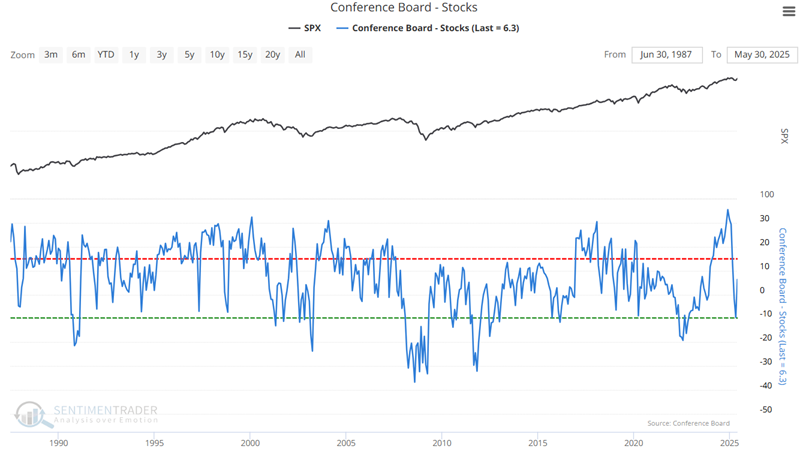
Like most other sentiment surveys, this is typically a coincidental indicator. When times are good, consumers are happy; when times are bad, they are less optimistic. The keys to watch for as investors are when divergences occur between sentiment and the stock market, especially times of extreme confidence or pessimism.
At the extremes, the survey is a decent contrarian indicator. However, during any extreme trend, it is difficult to say with certainty how long it will last and how far it will go. As a result, for trading purposes, it can be helpful to wait for a meaningful reversal after an extreme reading before acting.
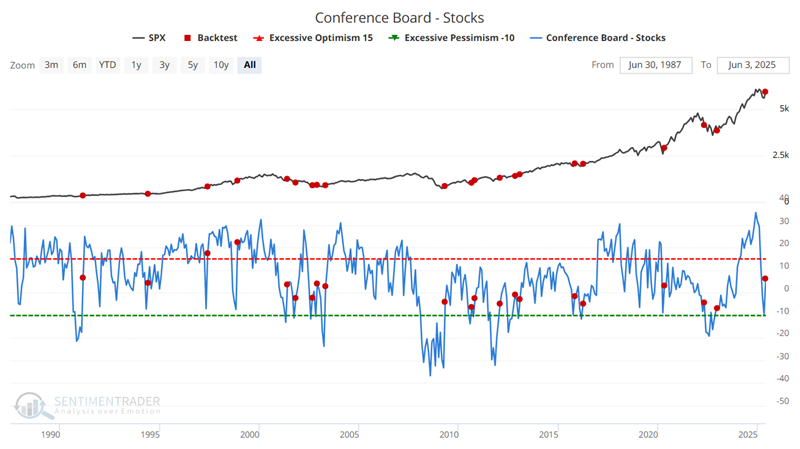
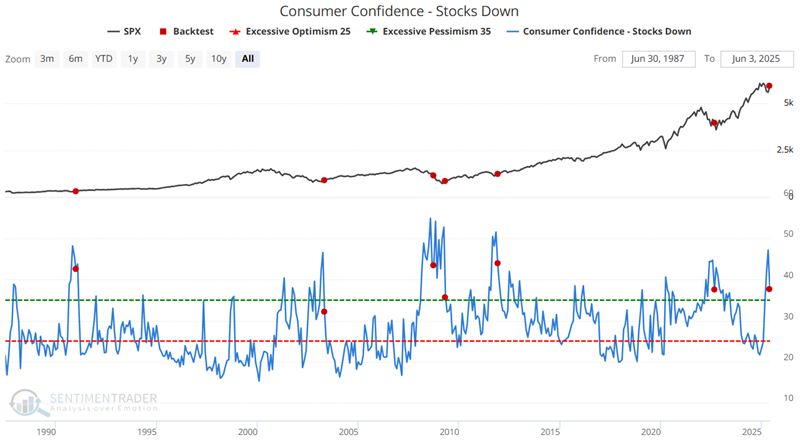
The chart below highlights all dates (including overlaps) when the Conference Board - Stocks index crossed above -7. The most recent signal occurred on 2025-05-30.
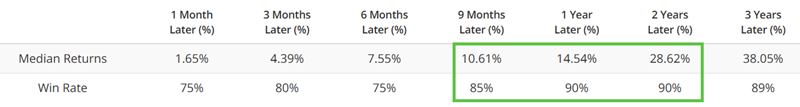
The table below summarizes S&P 500 performance over the following three years. Notice the strong performance numbers for nine months to two years after a signal.
The table below displays S&P 500 performance on a signal-by-signal basis.
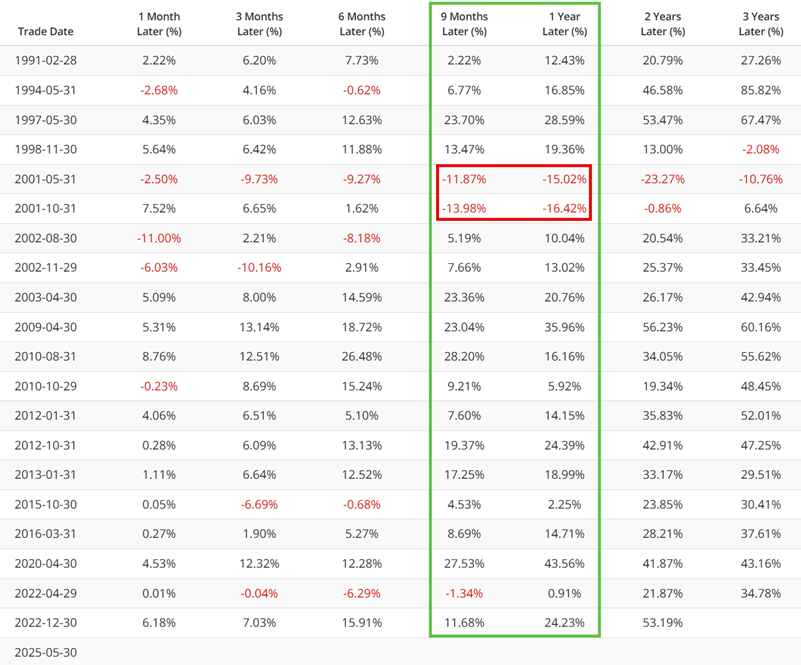
The nine-month and one-year timeframes show excellent overall performance. However, the two signals in 2001 (highlighted in red box) remind us that no signal is infallible and that this signal should be viewed as "weight of the evidence" and not as an automatic buy signal.
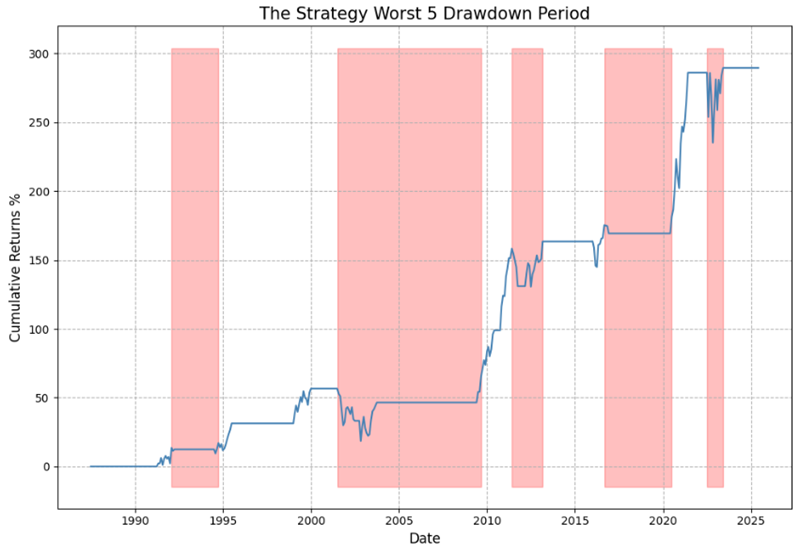
The chart below displays the hypothetical equity curve for holding the S&P 500 index for one year after a new signal. Equity curves help us understand the nature of performance - i.e., the consistency (or lack thereof) of gains and the "bumps in the road."
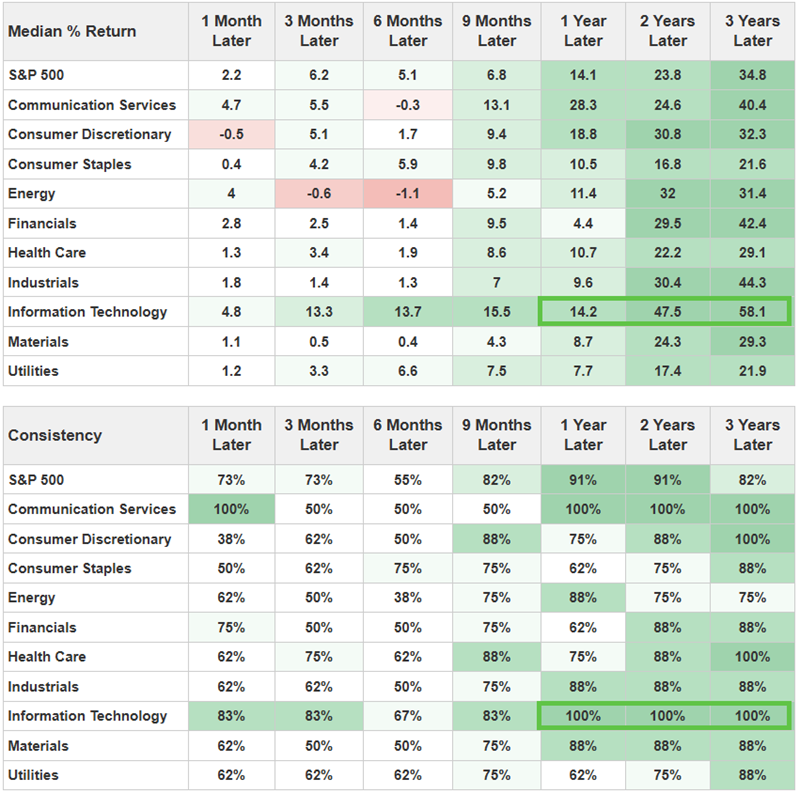
The table below summarizes sector performance following the first new signal in one year. Unsurprisingly, technology has been the most consistent performer in this bullish market environment.
Focusing only on Conference Board - Stocks Down
The Conference Board - Stocks Down indicator shows the net percentage of consumers expecting stocks to decrease, according to a monthly survey from the Conference Board. As the market declines, this indicator typically rises as investors become more pessimistic. Once again, we want to look for a reversal from an extreme level to suggest that the stock market may be turning the corner.
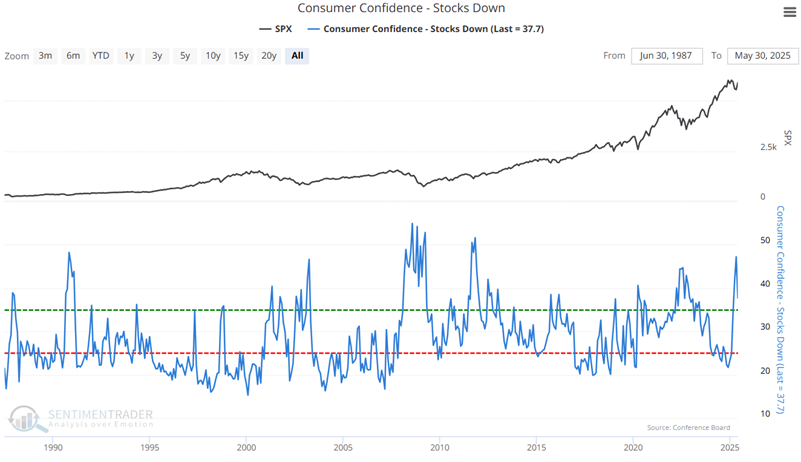
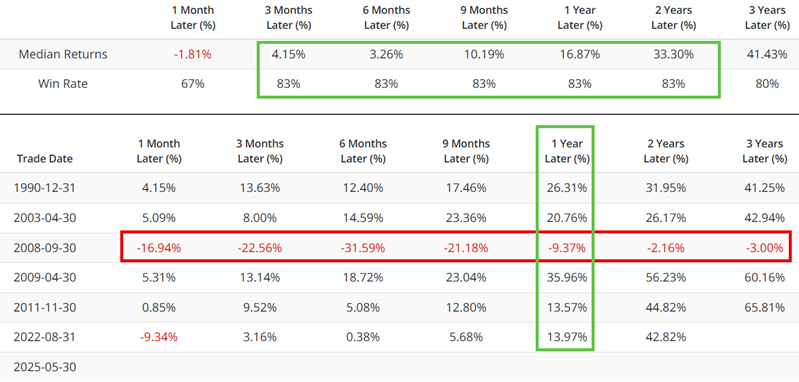
The chart below highlights all dates when the index fell back below 44%. Here, too, the latest signal occurred on 2025-05-30.
The table below displays S&P 500 performance following the dates highlighted in the table above. For this signal, the 2008 signal serves as our reminder that other factors can influence stock prices more at times.
What the research tells us…
There is a reason we focus so much attention on sentiment indicators. In a nutshell, regardless of any and all changes in the marketplace, human nature (i.e., fear and greed) remains the one thing that never changes. Anytime we can identify an extreme in investor psyche, there is a very good chance it is telling us to start looking in the opposite direction. The recent spasm of fear appears to have been reversed. Does this mean the market is destined to rally? Or will we get an "exception to the rule" like 2001 or 2008? The reality is, we can't predict. But for now, the weight of the evidence regarding the indicators detailed above lies on the favorable side of the ledger.