
More Indicators Lining Up on the Favorable Side of the Ledger

NOTE: Please see my update regarding the Gold/Silver Ratio under Tools | Intraday Minutes or simply click here.
Key points:
- We prefer a weight-of-the-evidence approach to assessing the trend of the stock market
- Risk on behavior (i.e., aggressive buying on the part of investors) is essential to sustaining a bull market
- Our Dumb Money Confidence, S&P High Beta/S&P High Quality Relative Ratio Rank, and Micro Cap / S&P 500 Relative Ratio Rank indicators have all flashed "Risk On" signals recently
Dumb Money Confidence touches a significant level
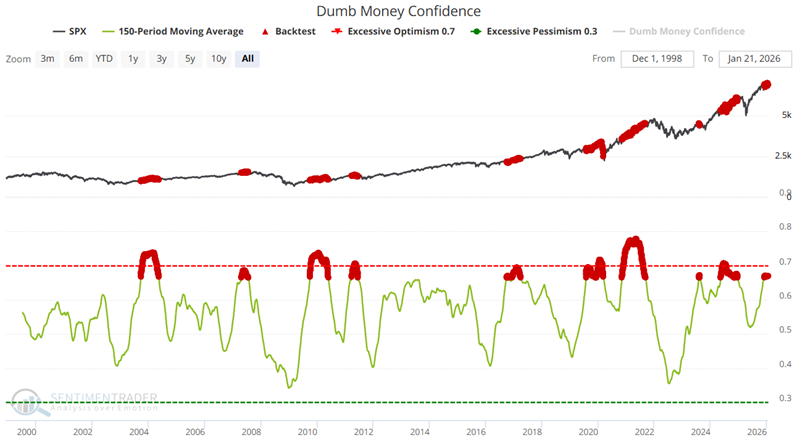
The first indicator test we will examine looks at the 150-day average of our Dumb Money Confidence. Theoretically, Dumb Money Confidence readings are unfavorable for stocks. However, when we apply a long-term approach, it tends to act more like a trend-following indicator.
The chart below highlights all dates when the 150-day moving average for dumb Money Confidence was above 0.669. As we can see below, this tends to occur during market uptrends and more often than not has seen further follow-through to the upside.
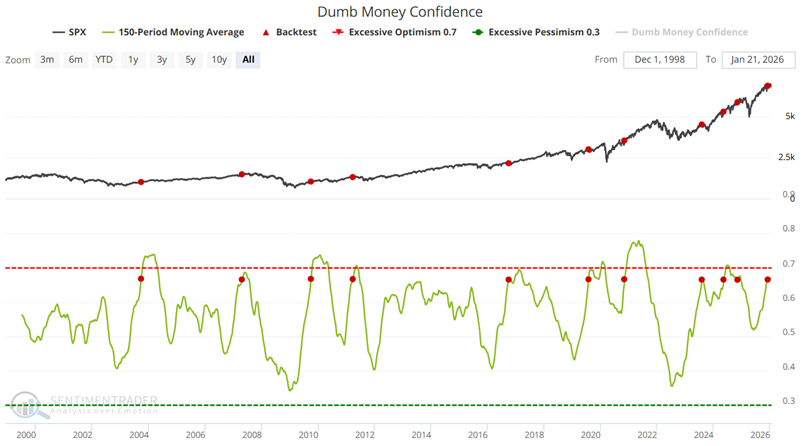
Let's refine things a bit and look only at the day when the 150-day average of Dumb Money Confidence first crosses above 0.669.
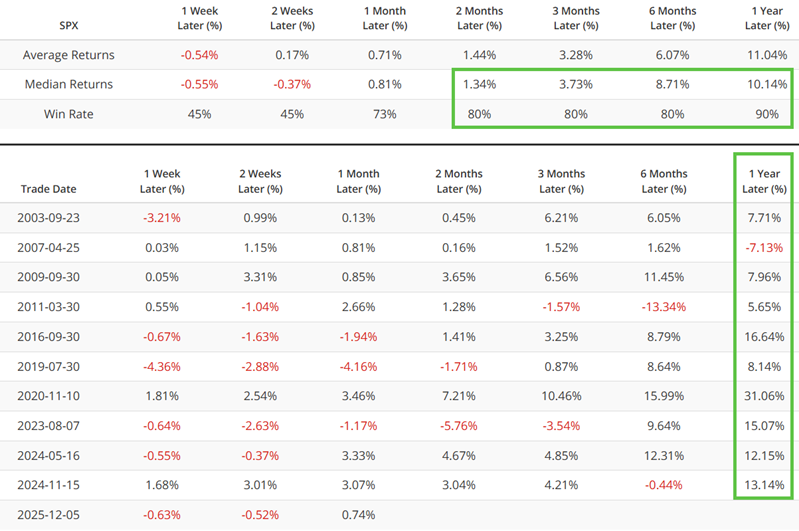
The table below summarizes S&P 500 performance following the dates highlighted in the chart above. The key thing to note is the consistent Win Rates for two months and out.
The S&P High Beta/ S&P High Quality Relative Ratio Rank indicator shows Risk On behavior
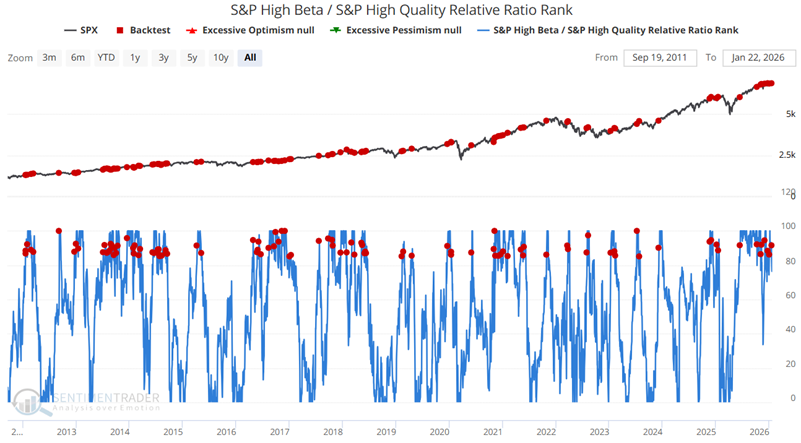
The S&P High Beta/S&P High Quality Relative Ratio Rank indicator shows where the ratio lies within its range over the past four months. When the relative ratio is high, investors are showing risk-on behavior. When the ratio drops to a low level, they are exhibiting risk-off behavior.
The chart below highlights all dates when the indicator crossed above 85.
The table below summarizes S&P 500 performance following the dates highlighted in the chart above. The key thing to note is the consistent Win Rates for two months and out.
Would we use this indicator as a standalone trading system? Not likely. However, as a weight-of-the-evidence tool, it is useful. Risk-on behavior - i.e., investors buying aggressively - is essential to sustaining a bull market. The recent cluster of signals is constructive for the stock market over the next six to twelve months.
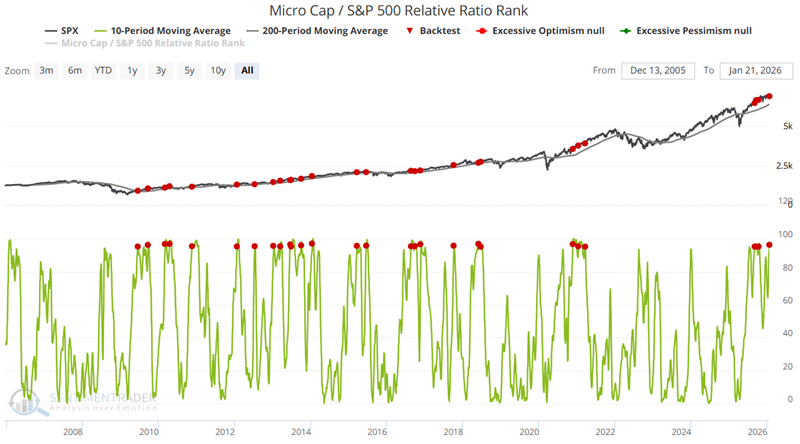
The Micro Cap / S&P 500 Relative Ratio Rank also shows Risk On behavior
Like the previous indicator, this one shows where the ratio between micro-cap stocks and S&P 500 stocks lies within its range over the past four months. When the relative ratio is high, investors are showing risk-on behavior. When the ratio drops to a low level, they are exhibiting risk-off behavior.
The chart below highlights all dates when the:
- Micro Cap / S&P 500 Relative Ratio Rank 10-day average crossed above 95
- S&P 500 Index was above its 200-day moving average
These rules highlight when investors are becoming particularly aggressive (i.e., rotating into very small-cap stocks, which tend to be more volatile) within the context of an established uptrend.
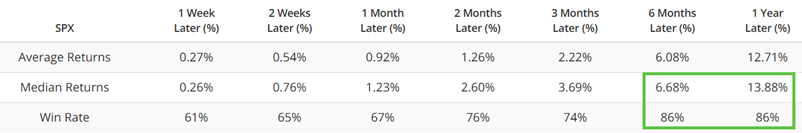
The table below summarizes subsequent S&P 500 performance.

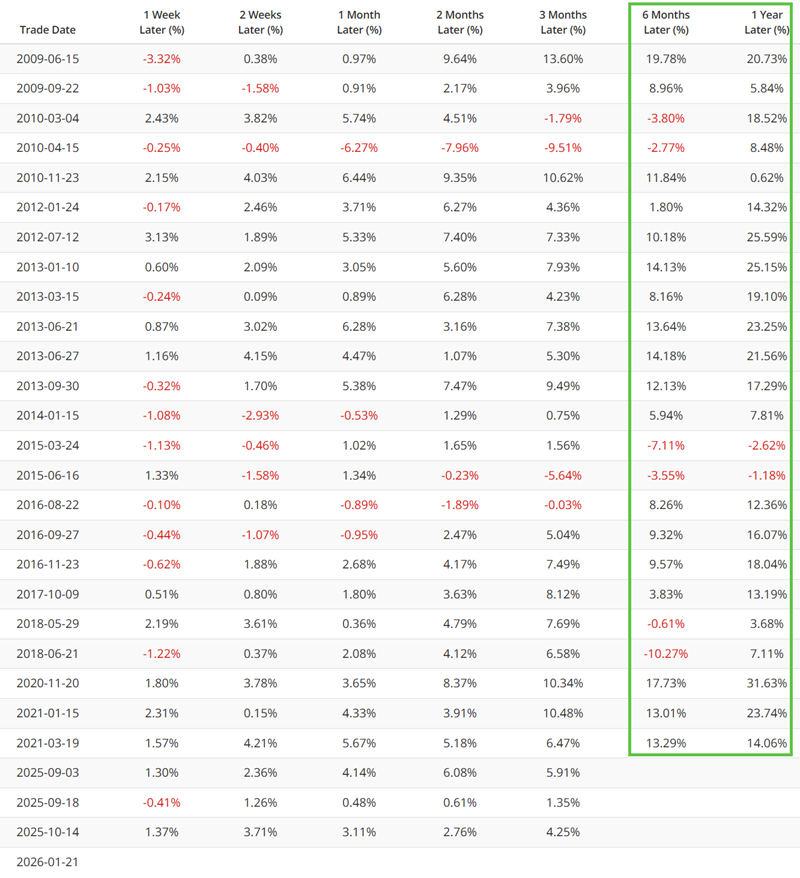
The table below displays the results on a signal-by-signal basis, including all overlapping signals.
We can refine this one a bit, also. The chart below highlights all dates when the:
- Micro Cap / S&P 500 Relative Ratio Rank 5-day average was equal to 100 for the first time in 21 days
- S&P 500 Index was above its 150-day moving average
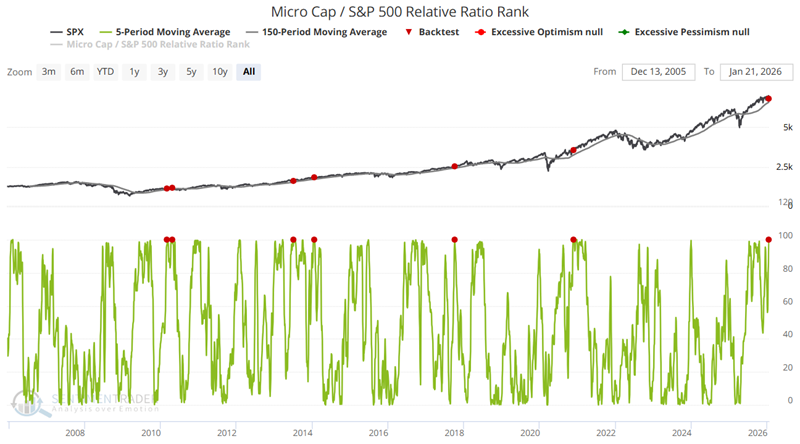
The table below summarizes subsequent S&P 500 performance.
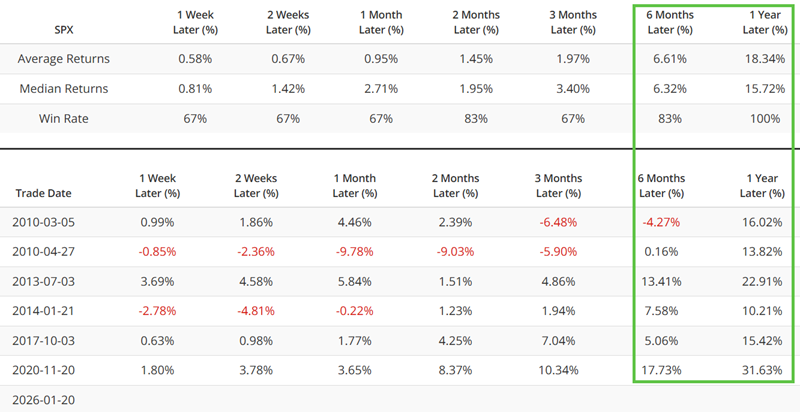
The high Win Rates for six and twelve months do not guarantee that the stock market is destined for smooth sailing and ever higher prices in the year ahead. They do, however, add significant weight to the favorable side of the weight of the evidence ledger.
What the research tells us…
One mistake people often make is looking at the red dots in charts like the ones above and automatically equating them with a "Buy" signal. Indicator signals (in my opinion) offer information, and do not automatically qualify as a "call to action." The information above indicates that there remains a significant weight on the favorable side of the ledger. Until price action rolls over in a meaningful way - especially if accompanied by significant warning signs from other indicators - the weight of the evidence still suggests that investors give the bullish case the benefit of the doubt.