
More indicators and models offering favorable confirmation

Key points
- Favorable indicator signals should be thought of as "weight of the evidence" and not as automatic "buy signals"
- Still, when a variety of typically reliable indicators generate favorable signals within a short time, it often signifies a buying opportunity for stocks
- S&P 1500 stocks, our Aggregate Signal Model, and our Risk Appetite Index recently flashed favorable signals
A favorable confirmation from S&P 1500 stocks
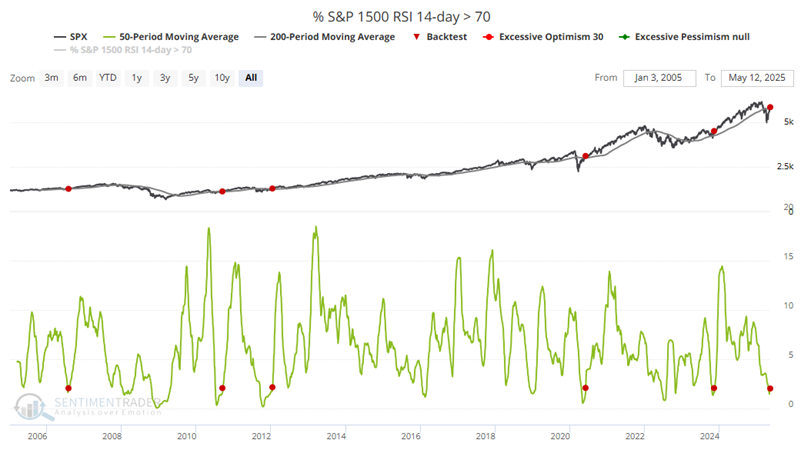
The % S&P 1500 RSI 14-day > 70 indicator is calculated by determining the 14-day RSI values for each of the S&P 1500 symbols and then determining the percentage of those at 70 or above.
The chart below highlights those rare occasions when:
- The 50-day moving average of % S&P 1500 RSI 14-day > 70 crossed above 2 (i.e., it dropped below 2% and then reversed higher)
- AND the S&P 500 is above its 200-day moving average
The table below summarizes historical results and displays signal-by-signal results.
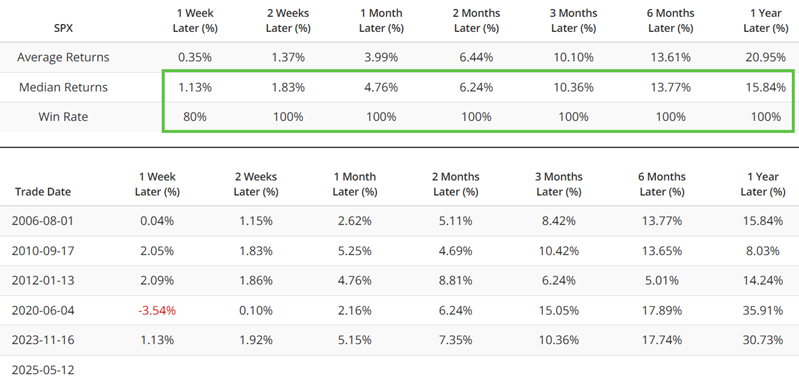
While the sample size is inarguably small, this is simply not a signal that will occur very often. It will only occur after a sharp rebound following a deeply oversold condition.
The most recent signal occurred on 2025-05-12. Historical results aside, this does not guarantee a positive follow-through. However, given the history, this does fall on the favorable side of the weight of the evidence ledger and strongly suggests giving the bullish case the benefit of the doubt.
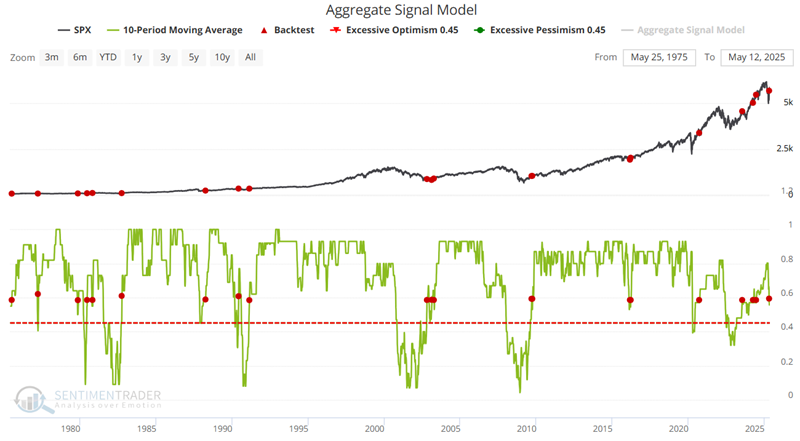
A favorable confirmation from our Aggregate Signal Model
Speaking of longer-term favorable confirmations, the chart below highlights all dates when the 10-day moving average of our Aggregate Signal Model crossed above 0.58.
The table below summarizes historical results.
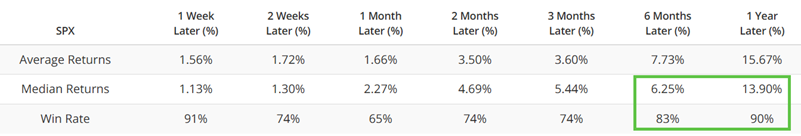
The table below displays signal-by-signal results (including overlapping signals).
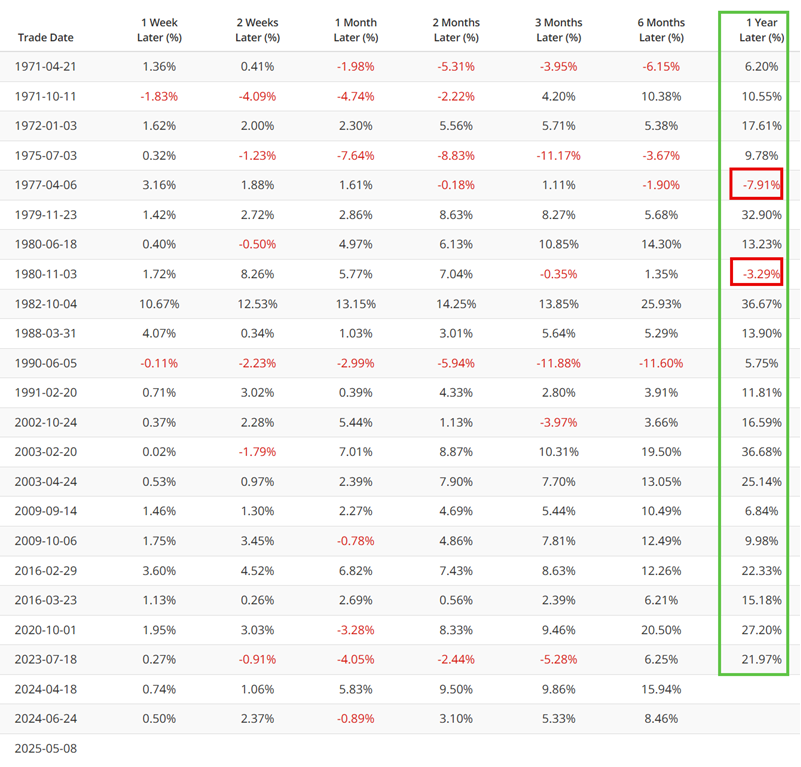
The most recent signal occurred on 2025-05-08.
A favorable confirmation from our Risk Appetite Index
Speaking of longer-term favorable confirmations, the chart below highlights all dates when the 20-day moving average of our Risk Appetite Index crossed above 0.13.
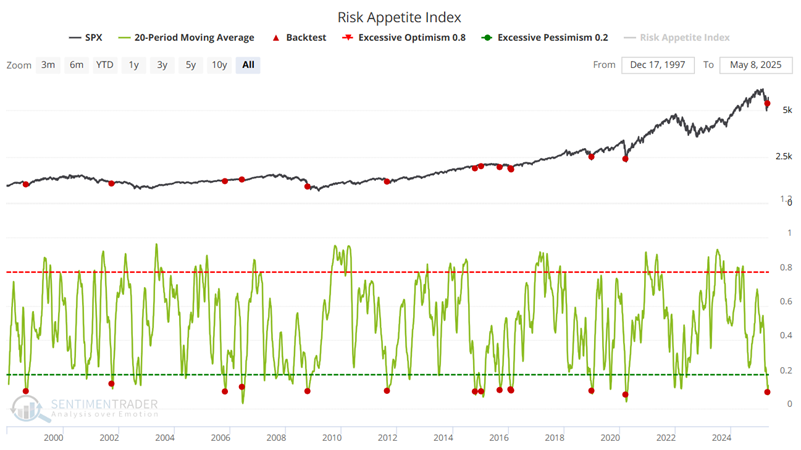
The table below summarizes historical results and displays signal-by-signal results.
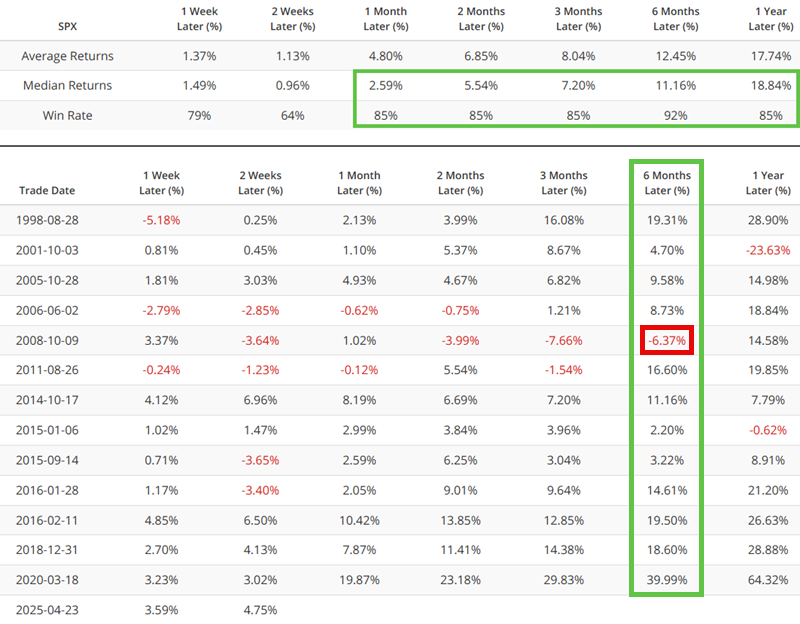
The most recent signal occurred on 2025-04-23.
What the research tells us…
Each of the indicator signals highlighted above has a solid long-term track record on a standalone basis. Combined, they offer a powerful argument that the outlook is favorable for stocks. That said, it is always important to remember that no favorable indicator - or combination of indicators -guarantees higher stock prices. Nevertheless, from a "weight of the evidence" perspective, the information above suggests giving the bullish case the benefit of the doubt unless and until price action provides us with a reason not to.