
More indicator signals to confound the bears

Key points
- Some indicator signals are best used not as a standalone trading system but as weight of the evidence
- The Equity Put/Call Ratio, the ROBO Put/Call Ratio, and the VIX Index have all flashed typically useful signals recently
- Individually, any signal can be called into question - but taken together, they lend weight to the argument that the favorable environment for stocks may persist for longer than many suspect
The Equity Put/Call Ratio spikes
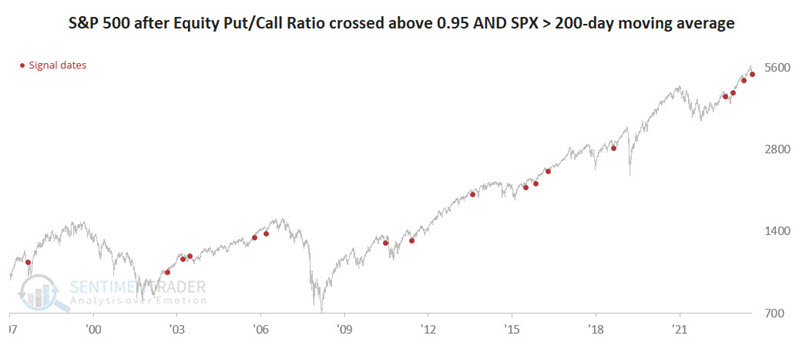
Some indicators have typically proven helpful in identifying buyable pullbacks in an ongoing uptrend. The Equity Put/Call Ratio indicator fits this description. The chart below highlights all dates when the indicator crossed above 0.95 while the S&P 500 Index was above its 200-day moving average.
The high Win Rates and favorable Z-scores shown in the table below suggest good reliability (with the caveat that any individual signal can be completely wrong).
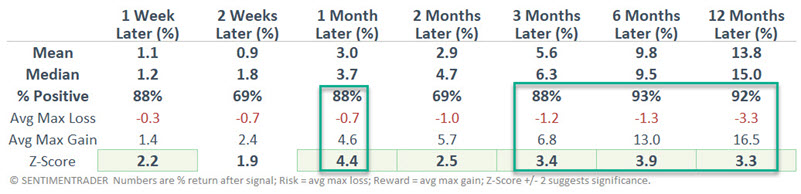
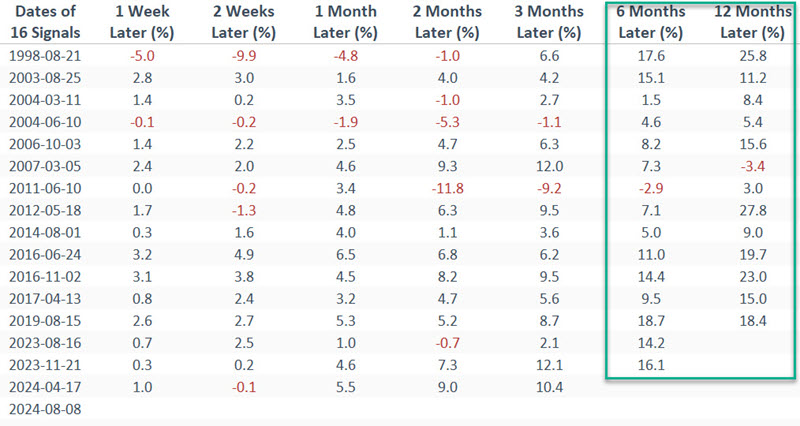
The table below displays the S&P 500 performance following the dates highlighted in the chart above.
The most recent signal generated on 2024-08-08 suggests a favorable outlook for stocks in the year ahead.
The ROBO Put/Call Ratio suggests panic among small traders
ROBO is an acronym we coined for Retail-Only, Buy-to-Open. This ratio focuses on small traders to better understand what they're trying to do. When looking at put/call information, it is helpful to see if the volume goes into opening or closing transactions, as it will tell us how aggressive the traders are in betting on a market move. Also, especially for very small traders, buying options to open is more telling than selling options to open.
A small trader buys a call option to open a position for one reason - he thinks his stock is going higher. He buys a put option to open because he thinks his stock is going down. You may argue that he's trying to hedge some underlying stock position, but it doesn't matter. If he thinks his stock is going up, he won't buy a put just for the thrill of it.
Suppose we isolate the trades to just those of ten contracts or less and further restrict them to buys and opening transactions only. In that case, we can get an accurate picture of what retail traders (i.e., small brokerage firm customers) are doing. This ratio looks at transactions that are buy-to-open only and only for those trades that are under ten contracts. Therefore, it is an excellent read on the emotions of the smallest of traders and should be interpreted in a contrary manner.
When the ROBO put/call ratio is high, small traders buy many puts in relation to calls, suggesting that they believe their stocks will decline. This is bullish for the market once it reaches an extreme. On the other hand, when these traders are so confident of their stocks rising that the ROBO ratio drops to a low level, we need to be aware that sentiment is becoming too frothy, and a market decline may soon be at hand.
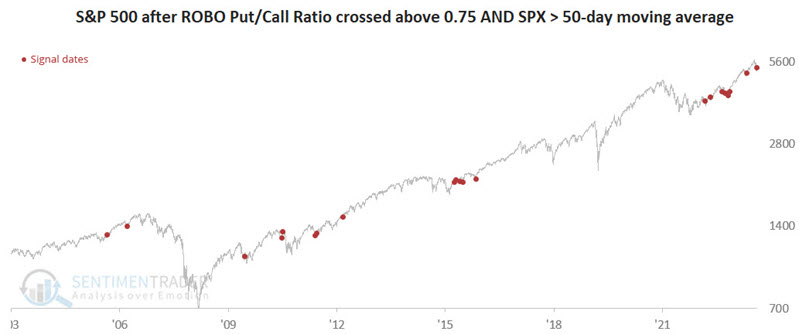
The chart below highlights all dates when the indicator crossed above 0.75 while the S&P 500 Index was above its 50-day moving average.
The high Win Rates and favorable Z-scores in the table below suggest good reliability.
The table below displays the S&P 500 performance following the dates highlighted in the chart above.
The most recent signal was generated on 2024-08-09.
The VIX Index spikes to a meaningful level
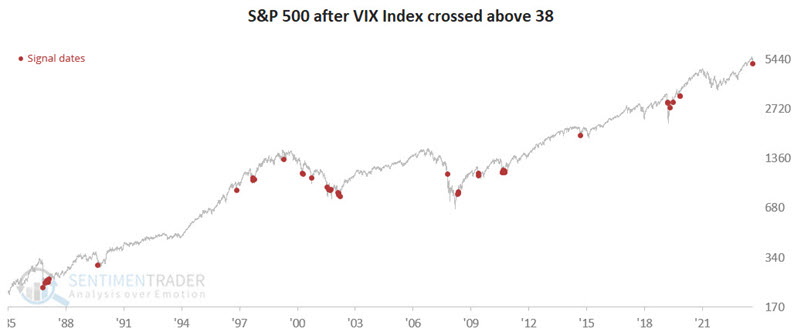
The VIX Index, also called the "Fear Gauge," spiked significantly high early in August. While this type of signal can often occur too early - and can be followed by a meaningfully greater decline before a bottom is established - they tend to identify good periods to consider buying stocks for solid gains in the ensuing twelve months.
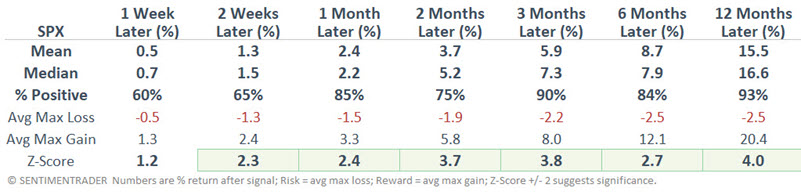
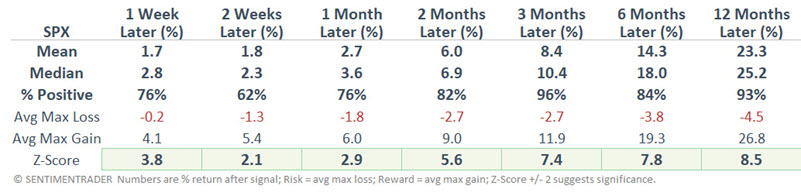
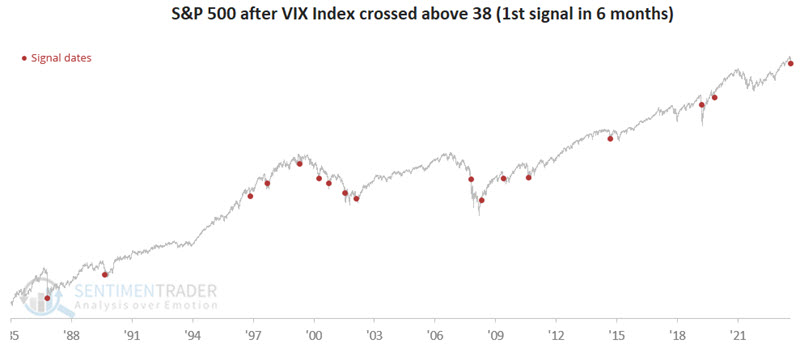
The chart below highlights all dates when the VIX Index crossed above 38.
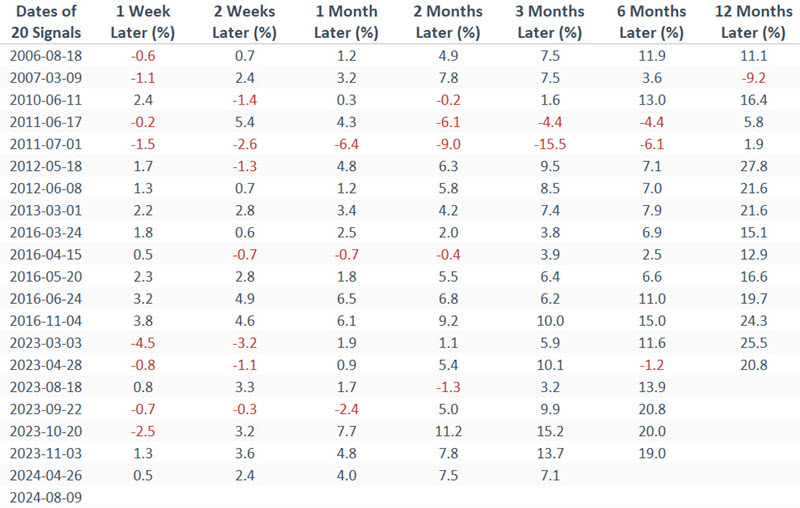
The tables below summarize S&P 500 performance and display signal-by-signal results. These results include all overlapping signals.
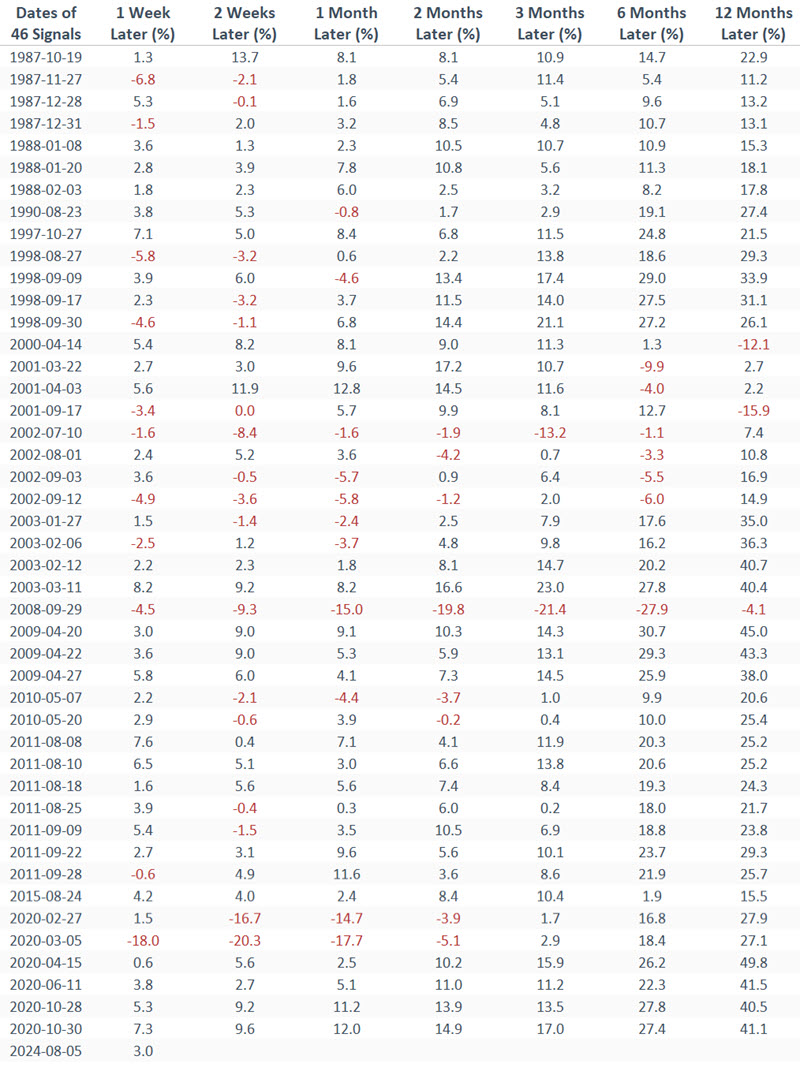
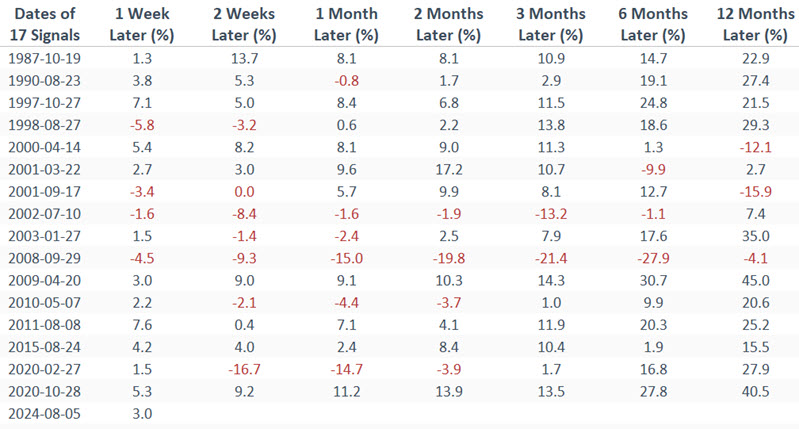
During severe market declines, the VIX may rise and fall above 38 on multiple occasions as the stock market experiences extreme volatility fluctuations and can generate overlapping signals. The chart below highlights only the first such signal within six months of a previous signal.
The tables below summarize S&P 500 performance and display signal-by-signal results.
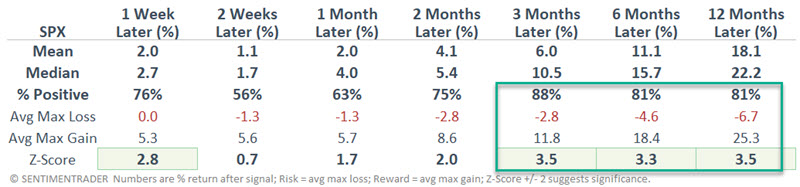
The results are slightly less robust than using "all signals" but are nonetheless significantly above average, particularly for three months and out.
What the research tells us…
None of the recent indicator signals highlighted above constitute a "sure thing" signal on their own. They each have demonstrated a decent track record of subsequent market performance but have generated significant "wrong" signals along the way. Nevertheless, when taken together, they point to the potential for continuing a favorable environment for stock market investors.