
More favorable signs for the healthcare sector

Key points
- The healthcare sector continues to be of particular interest and recently broke out to a new all-time high after two and a half years of consolidation
- Momentum based on new highs within the sector triggered recently
- A rare signal from a unique insider indicator also recently flashed green
The Healthcare sector has broken out to new highs
The chart below displays a bar chart for the Health Care Select Sector SPDR Fund (ticker XLV) over the last four-plus years. As you can see, the fund spent roughly two and a half years trading in a broad range before finally reaching new all-time highs in recent weeks.
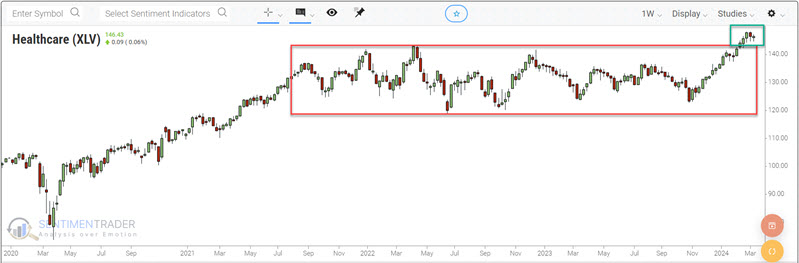
From a pure price perspective, the outlook couldn't be much more straightforward:
- As long as the price holds above the top of the red box in the chart above = GOOD
- Price falls back into the box in the chart above = BAD
A momentum signal bolstered the breakout
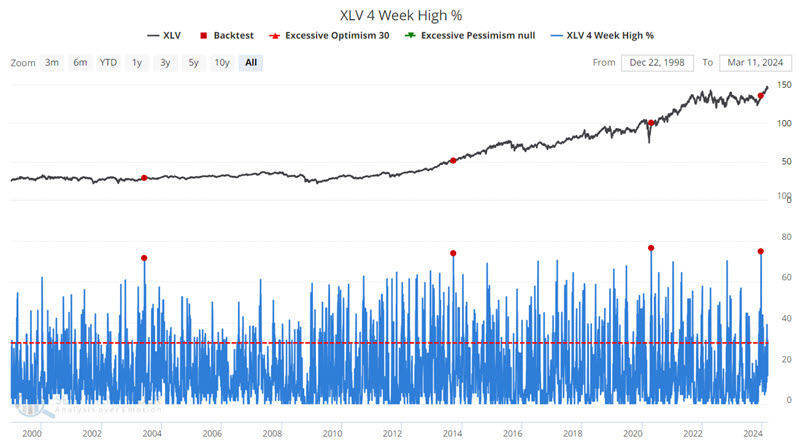
There is no guarantee that the price breakout will hold. However, the odds tend to improve when internal confirmations of strength accompany a breakout. One such potential sign (albeit one with a small sample size) occurred in December 2023, as the rally that led to the breakout was getting started.
The chart below highlights those rare occasions when the XLV 4 Week High % indicator crossed above 71%.
The table below summarizes subsequent XLV performance.
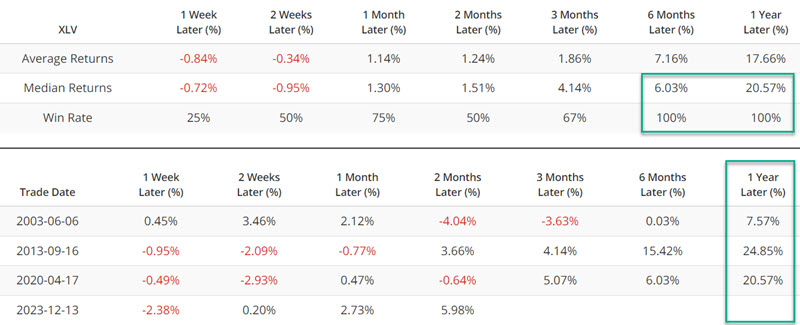
The obvious concern is the small sample size, with only three signals before the 2023-12-13 signal. However, the reality is that this type of "thrust" is simply an infrequent occurrence. Interestingly, initial results (1 week to 2 months) have historically been mixed. However, 6-month to 12-month returns have been decidedly favorable. This should not be surprising, as positive thrust signals (for the overall market and individual sectors) historically have tended to act like a rocket helping to launch a spaceship out of the atmosphere and into outer space.
That said, not every launch is successful. So, if XLV drops back into its previous price range, that would be a warning sign of a "failed launch."
A quirky insider signal to consider
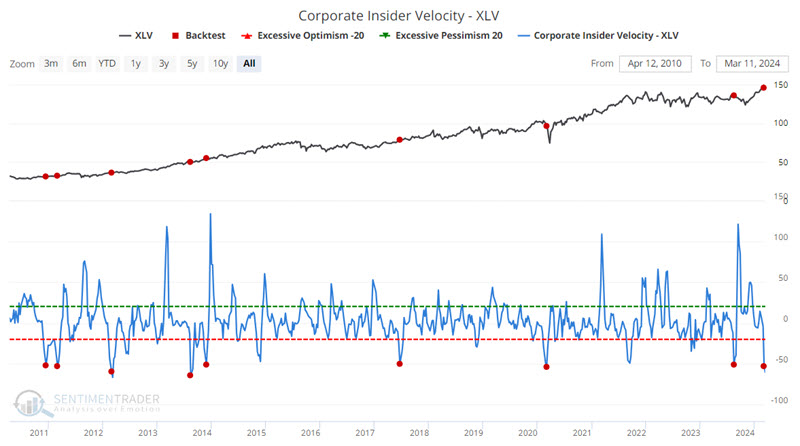
Our Corporate Insider Velocity - XLV indicator shows the velocity of corporate insider buying versus selling in XLV ETF (health care) stocks. It takes a 4-week rate of change for insider buys and subtracts a 4-week rate of change for insider sales.
The overarching theory is that higher readings suggest a surge in buying and is bullish, and vice versa. But here's where it gets quirky. When the reading reaches an extreme high or extreme low, it often signals just the opposite. Essentially, an extremely low reading in this indicator highlights a spasm of insider selling and usually serves as an "oversold" indicator.
The chart below highlights those rare occasions when the Corporate Insider Velocity - XLV indicator crossed below -50. The most recent signal occurred on 2024-03-04.
The table below summarizes subsequent XLV performance following previous signals.
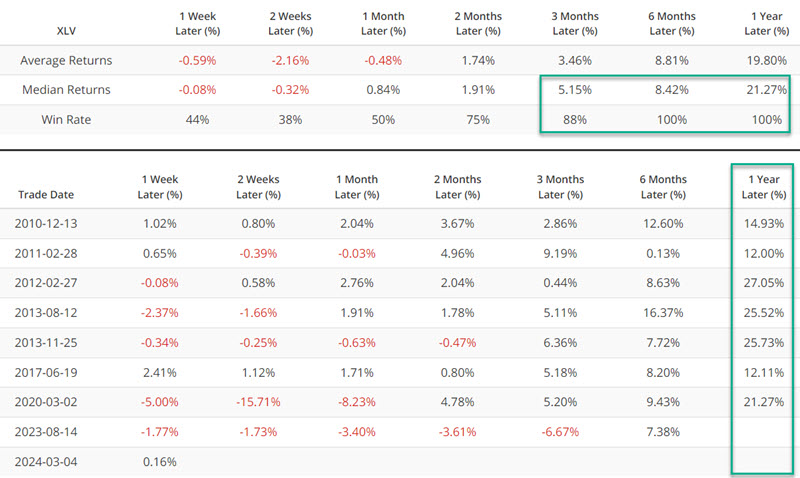
As with the 4-week New High indicator above, initial results have historically been mixed. Nevertheless, Win Rates and Median Returns have improved dramatically in the year following a signal. There is no guarantee that things will play out that way again following the March 2024 signal, but it does lend weight to the favorable side of the weight of the evidence ledger for the healthcare sector.
Other factors that weigh in favor
Regular readers are likely not surprised that the healthcare sector has shown recent strength. The first piece below highlighted on 2023-11-13 that several favorable factors were coming together for the healthcare sector.
It may be soon or never for healthcare (2023-11-13)
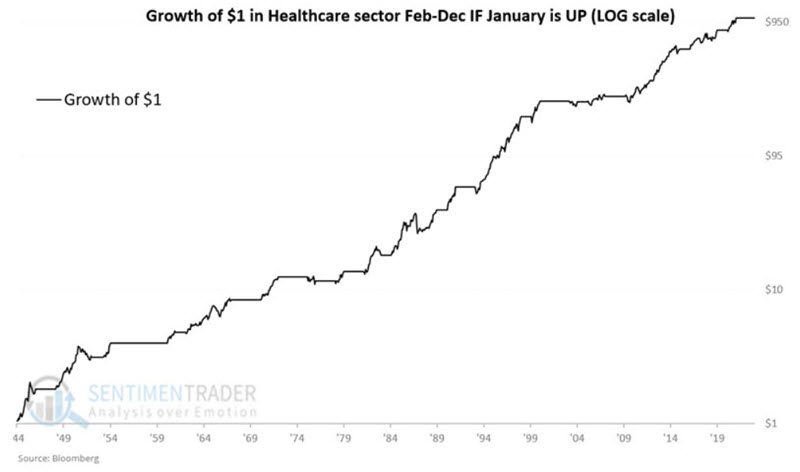
Likewise, the piece below highlighted something I call the "January Barometer for Healthcare," which gave a favorable signal on 2023-01-31.
Two good reasons to monitor the healthcare sector closely in January (2024-01-10)
As a reminder, the chart below displays the hypothetical growth of $1 invested in the S&P 500 Healthcare sector from February through December only during those years since 1944 when the sector showed a gain for January.
What the research tells us…
As always, there are never any guarantees in the market - no matter how many favorable signs align. That said, the job of investors is not to "predict" the future but to measure the weight of the evidence and assess where the probabilities are greatest for future success. The confluence of positive price action and favorable confirmation signals from various (typically) reliable indicators suggest that investors continue to give the bullish case the benefit of the doubt for the healthcare sector.