
More favorable evidence signals emerge

Key points:
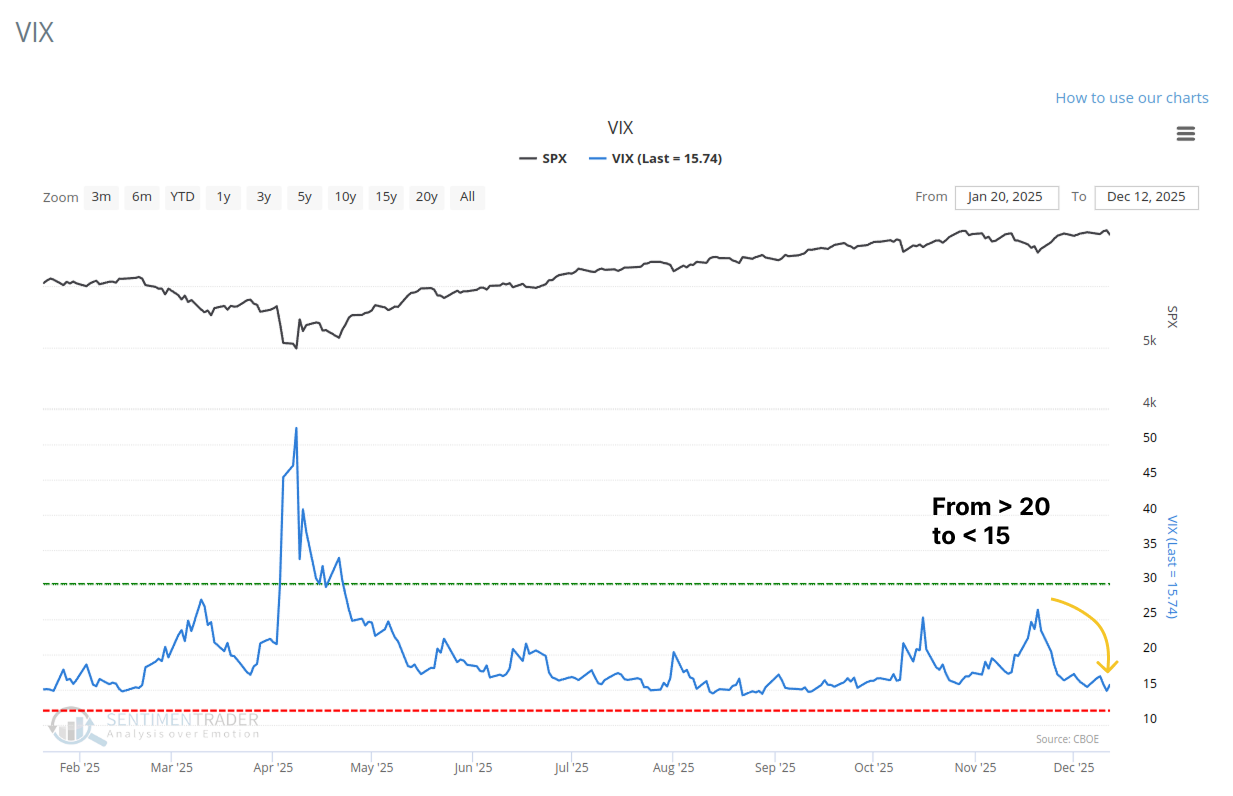
- The CBOE Volatility Index (VIX) has declined below 15 after spiking above 20, signaling a rapid dissipation of market fear.
- Historically, when the VIX cycles from above 20 to below 15, the S&P 500 has produced excellent returns over medium-to-long term horizons.
- A separate sentiment indicator, the Stock/Bond Ratio, has also crossed a key threshold, further supporting a bullish outlook.
Fear fades as volatility resets
The CBOE calculates a volatility index for the S&P 500, commonly known as the VIX or "fear gauge." It measures market expectations of near-term volatility (1 month) conveyed by index option prices. The VIX rises when investors are uncertain or fearful about a market's direction. Conversely, when apprehension subsides, volatility reverts lower.
During the summer, market volatility surged significantly, with the fear gauge briefly touching an intraday high of 52. However, as these events have calmed, the VIX closed below 15 last week after previously breaking above 20. This signal provides further support for the findings from our previously shared research, suggesting that yields may be poised to rise.
The last time expected volatility shifted from above 20 to below 15 was in July 2025, leading to a 5.5% gain in the S&P 500 over the subsequent three months.
How can I recreate this signal in the Backtest Engine?
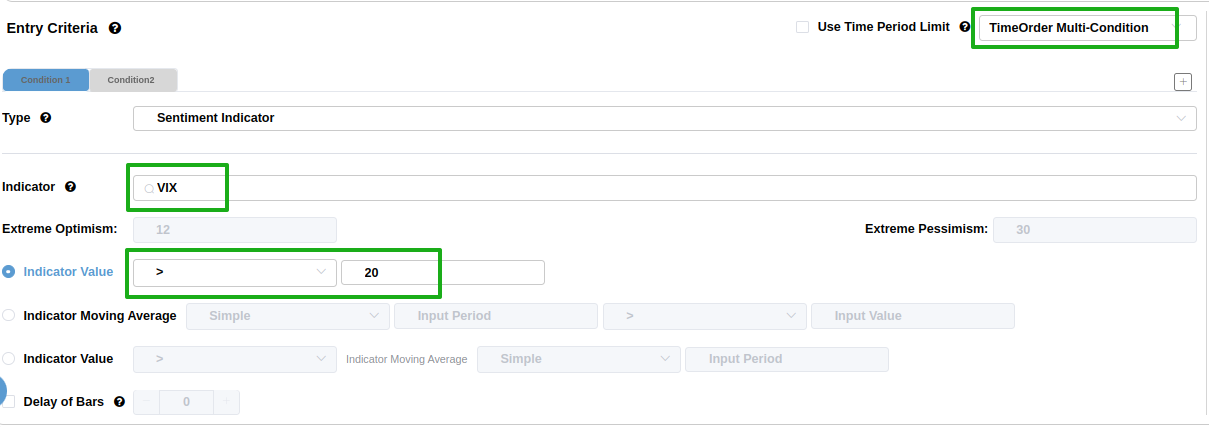
Complete the following tasks in the Entry Criteria section:
- Select TimeOrder Multi-Condition in the top right-hand corner
- In the Indicator search box, type VIX and select the indicator
- In the Indicator Value dropdown, select ">", and enter 20.
Click on the Condition2 tab and complete steps 2 from above. However, this time, select CrossBelow and enter 15.
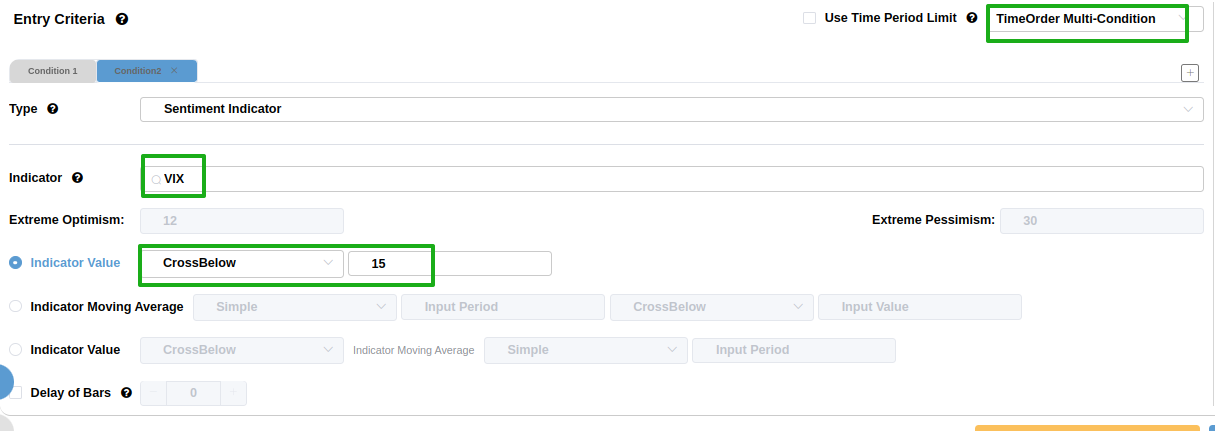
Finally, click on the Run Backtest button.
Similar reversals in expected volatility preceded a bullish outlook for stocks
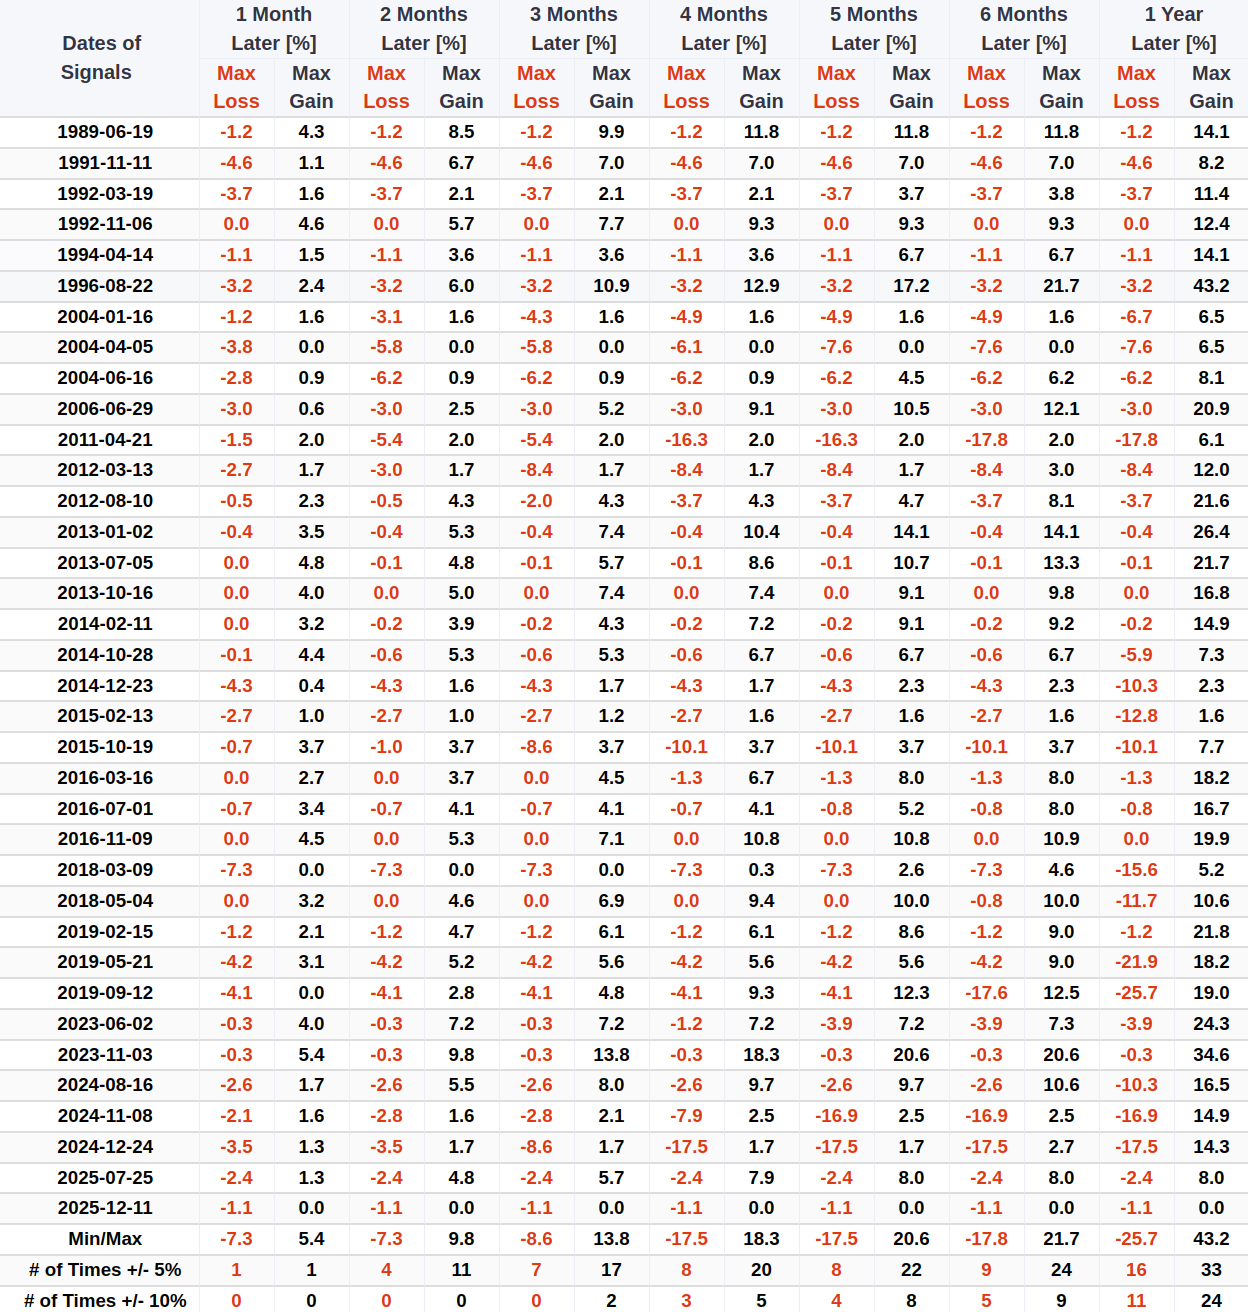
Whenever the VIX has cycled from above 20 to below 15, the S&P 500 has demonstrated excellent returns and stability over medium and long-term horizons. This is especially true one year later, where the world's most benchmarked index has risen in all but two instances. For related backtest, click here.
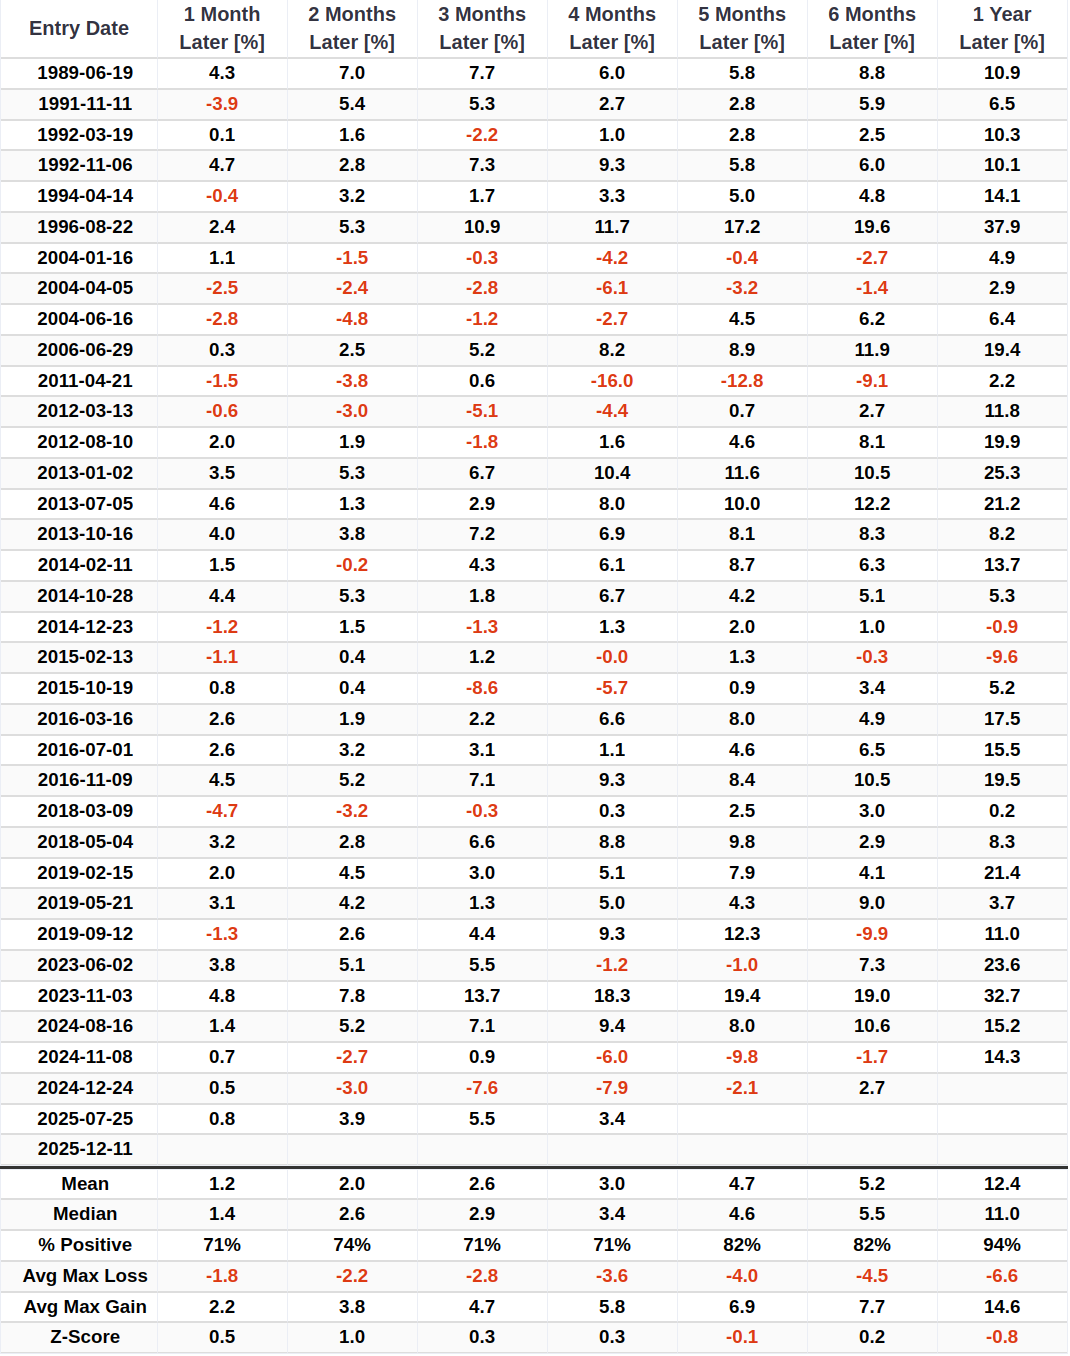
Over the subsequent three months, only seven precedents saw a maximum loss exceeding -5%, with the most recent occurrence in 2024. Furthermore, declines of 10% or greater were only observed at the four-month mark.
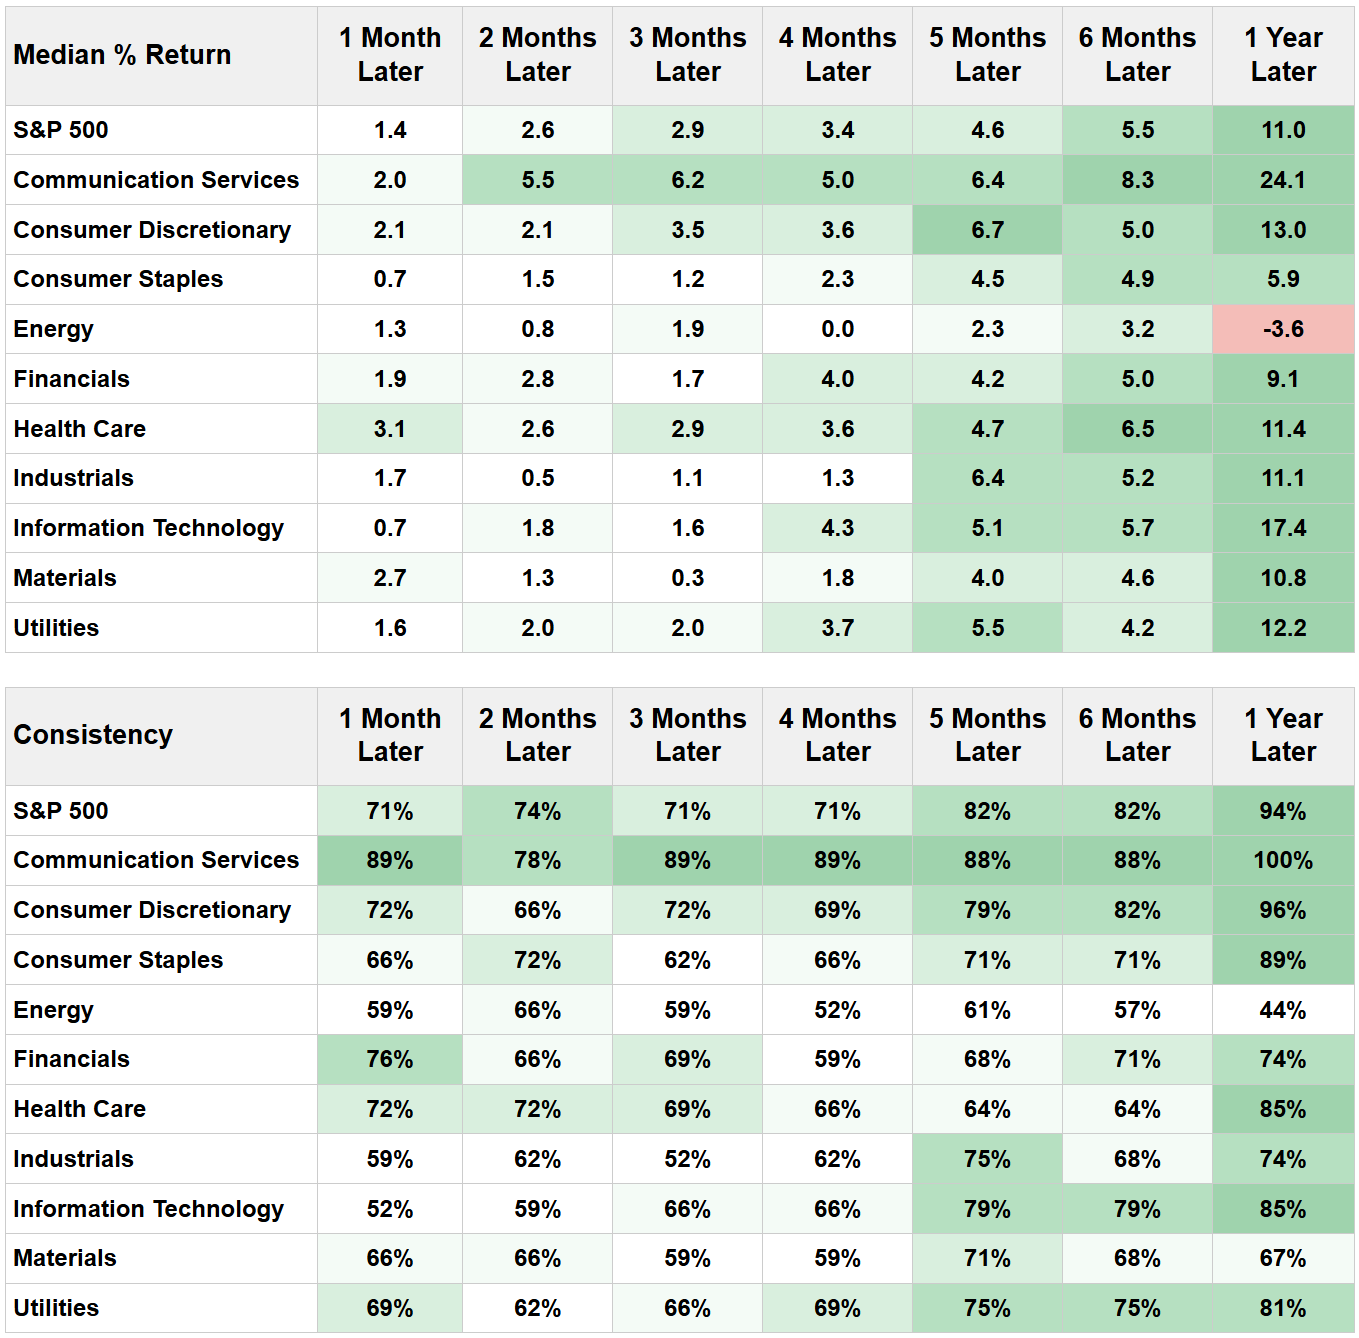
Over the next year, the Technology sector outperformed the S&P 500. Notably, defensive growth sectors like Health Care also tended to outperform the broader market.
Another sentiment indicator points to positive expectations
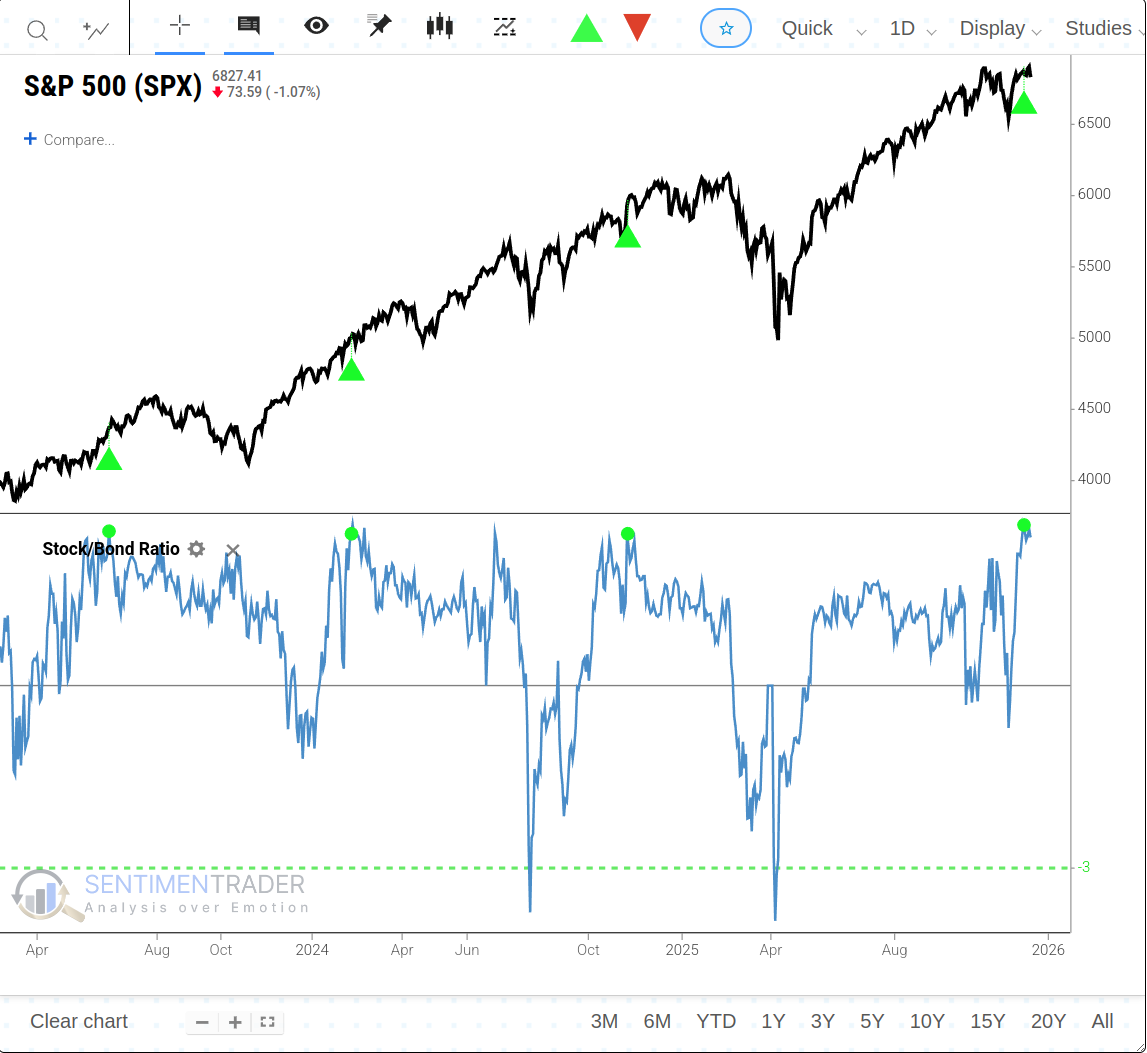
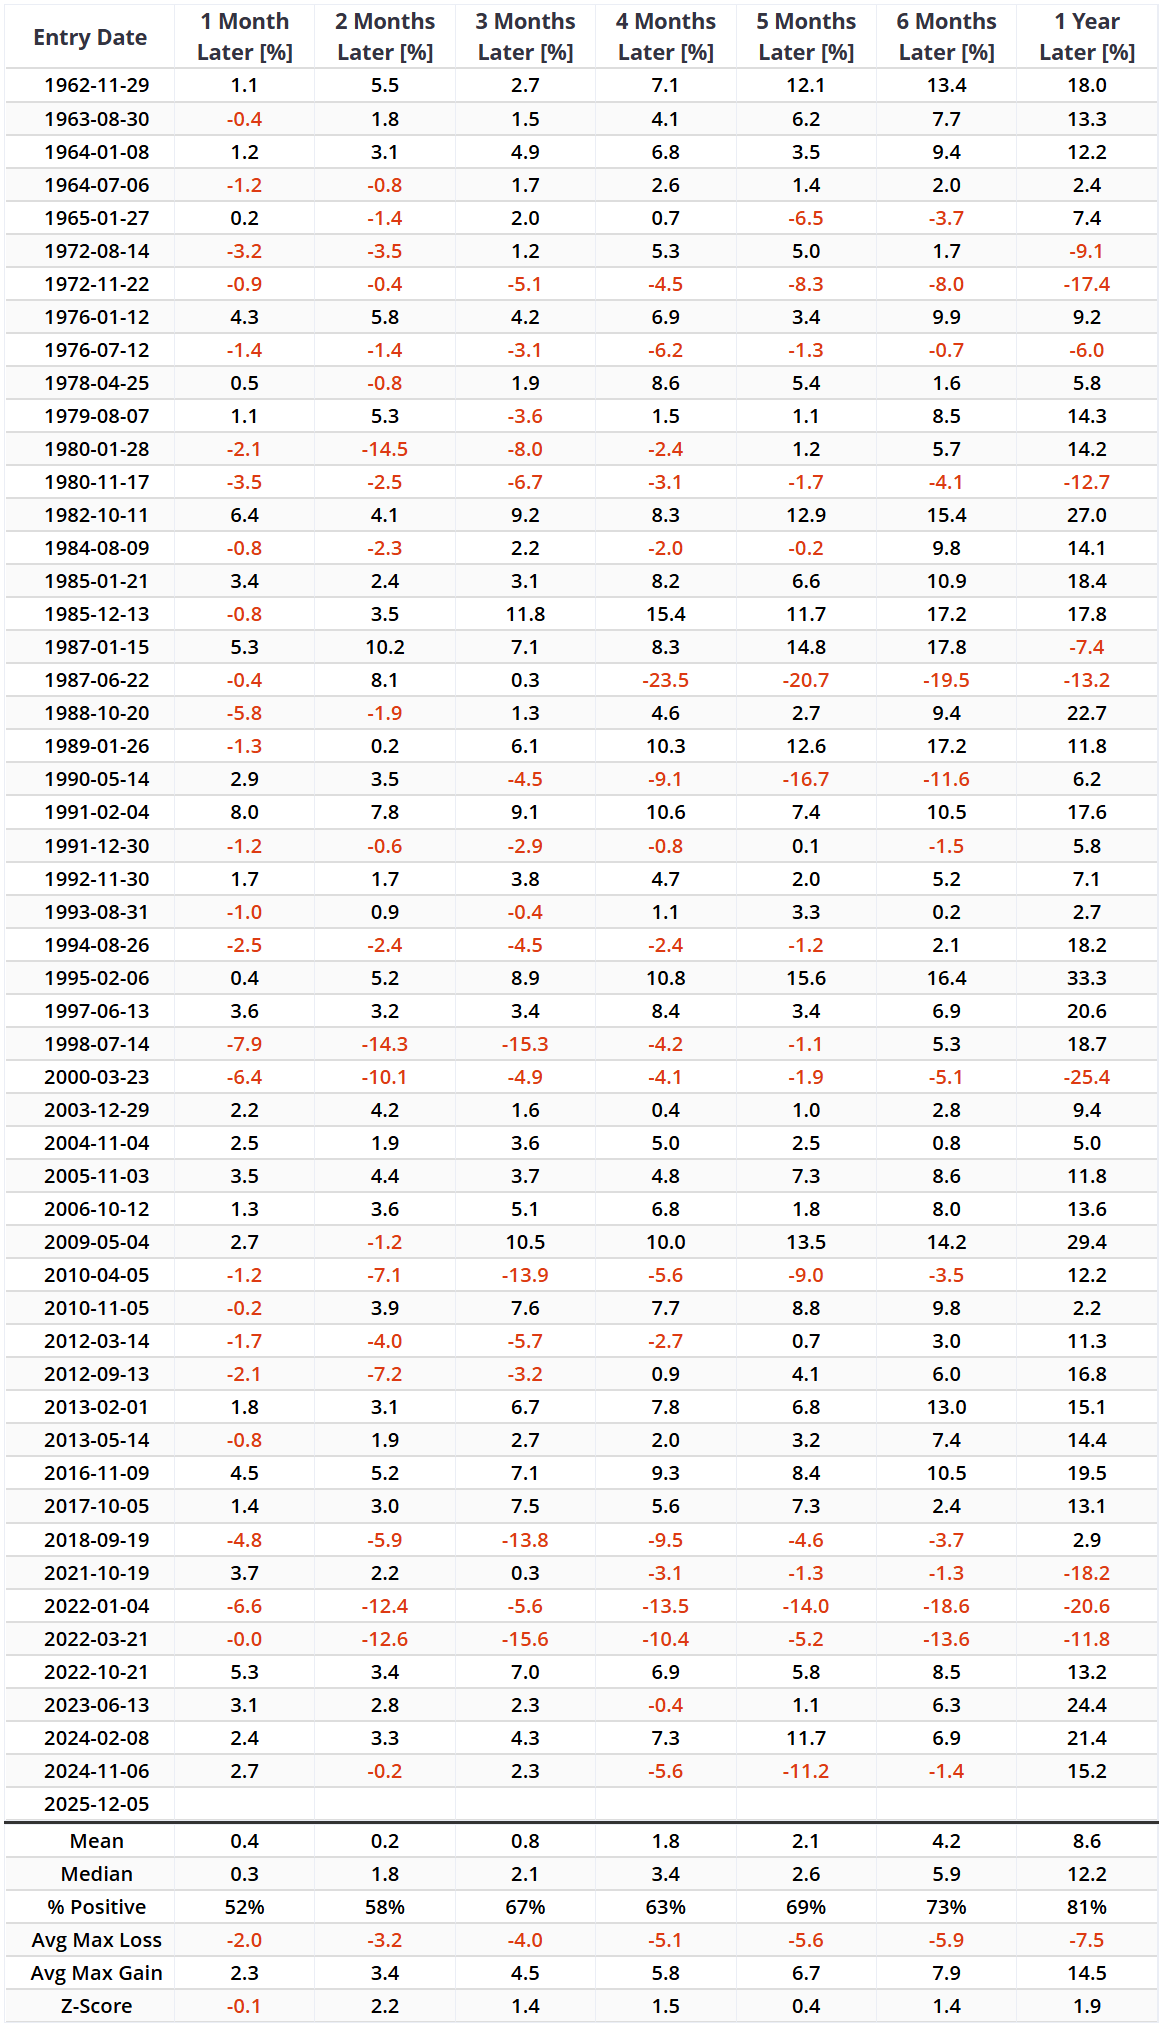
The Stock/Bond Ratio, while used to assess whether stocks are undervalued or overvalued relative to bonds, also serves as a reflection of market sentiment. When the Stock/Bond Ratio breaks above 2.5 after resetting below 0.0 (to filter out duplicate signals), the outlook for the S&P 500 has historically been favorable. The most recent breakout above 2.5 occurred on December 5, 2025. For related backtest, click here.
Whenever the Stock/Bond Ratio has broken above 2.5, the S&P 500 has achieved an 81% win rate one year later. It is worth noting, however, that a ratio breaking above 3 is often considered a danger signal in the short term, with a win rate of only 46% over the subsequent two months.
What the research tells us...
The recent decline in the VIX below 15 marks a significant shift in market psychology, indicating that the acute fear has largely dissipated. Historically, such "volatility resets" have acted as reliable buy signals, preceding sustained gains for the S&P 500. This constructive outlook is further corroborated by the Stock/Bond Ratio breaking above 2.5, a level that has historically signaled strong one-year returns. Current evidence indicates that the long-term stock market will continue its upward trend.