
More Favorable Continuation Signals to Consider

Key points
- It can be helpful to watch for continuation signals within an established uptrend
- These types of signals can highlight trading opportunities for shorter-term traders and a chance to put more money to work in the market for longer-term investors
- Our Hedge Fund Exposure and S&P High Beta/S&P High Quality Relative Ratio Rank indicators serve as examples that have recently flashed fresh signals
Hedge Fund Exposure
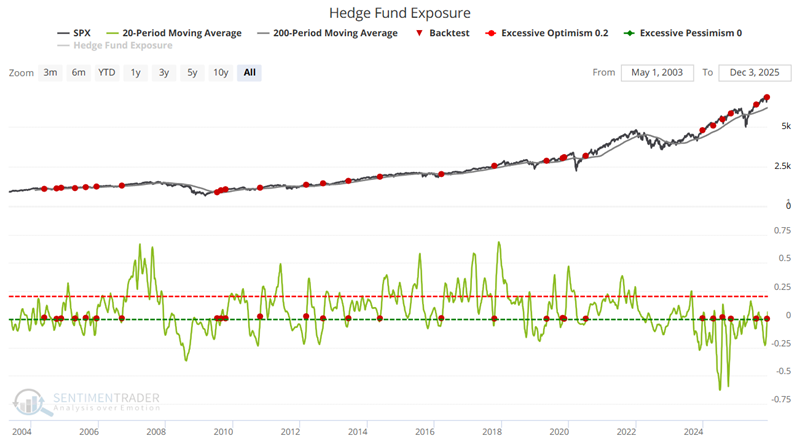
Our Hedge Fund Exposure indicator is based on a composite of hedge fund tracking indexes. It compares this index of hedge fund exposure against returns in the S&P 500 to see how much exposure hedge funds appear to have to the stock market. If they are highly exposed, then the index will rise more than stocks and vice versa. What we generally see is that when funds are heavily exposed to stocks, then the market is in danger of stalling out or falling as these funds retrench. When they are under-exposed, stocks may experience buying pressure as funds increase their exposure.
Does this data have any meaning for stock market investors? The chart below highlights all dates when:
- The 20-day moving average for Hedge Fund Exposure crossed above 0
- While the S&P 500 was above its 200-day moving average
In a nutshell, we are looking at this as a continuation indicator, i.e., hedge fund exposure to stocks reverses from negative to positive while the S&P 500 is in an established uptrend. The most recent signals occurred on August 8th and more recently on November 28th.
The table below summarizes the S&P 500 index performance following the signals highlighted in the chart above.
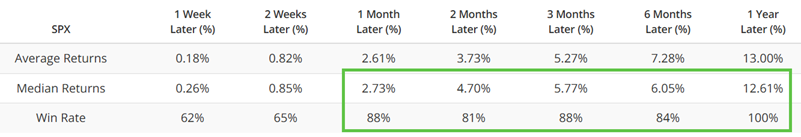
There is good news and not-so-good news in these results. The good news is that the high Win Rates of 81%+ are consistently high across all time frames, from one month to one year. The not-so-good news is that, while the median returns are decent and slightly above average for all dates, they are not spectacular. As a result, we would not necessarily want to use this as a standalone trading signal generator.
For comparison, the table below displays Win Rates and return data for ALL dates for the S&P 500 during the same period.
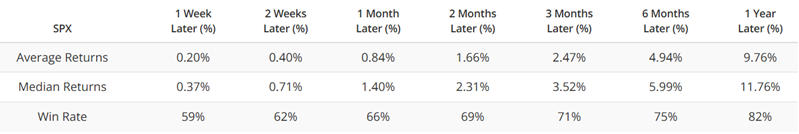
If history is a guide, the November signal suggests a high probability of higher stock prices in the year ahead - albeit with less spectacular returns than in recent years.
High Beta versus High Quality flashes another continuation signal
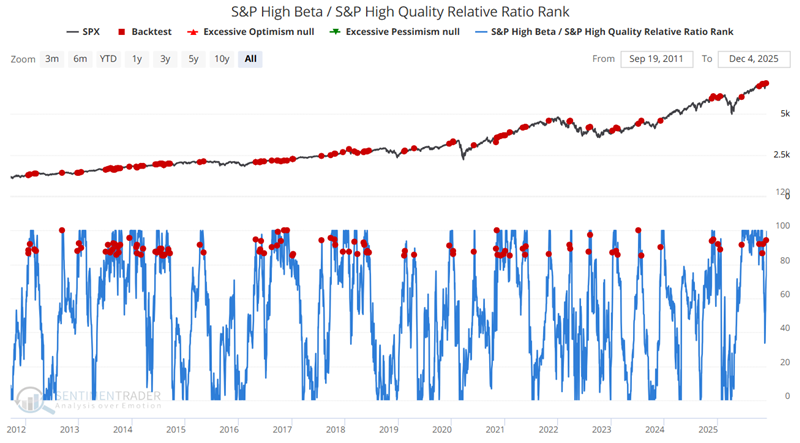
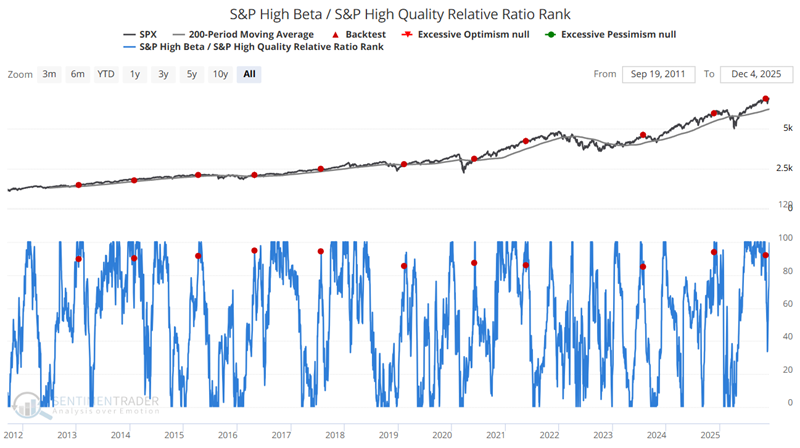
One version of a risk-on/risk-off indicator is our S&P High Beta/S&P High Quality Relative Ratio Rank indicator. A bull market advance needs aggressive buyers to step in and propel the market higher. One way to measure the level of this aggressiveness is by comparing the actions of high-beta stocks (i.e., those with higher volatility) to the performance of high-quality stocks (i.e., typically those with lower volatility).
The chart below highlights every instance of our S&P High Beta/S&P High Quality Relative Ratio Rank indicator crossing above 85 since 2012. A recent flurry of signals occurred on October 13th, November 5th and 10th, and again on December 3rd.
The table below summarizes subsequent S&P 500 index performance following the signals shown above.
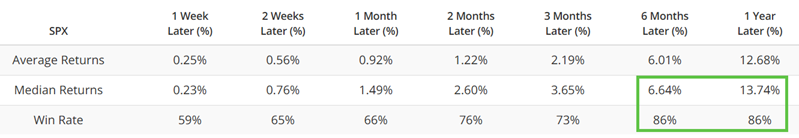
Both six-month and twelve-month results show above-average win rates and above-average median returns.
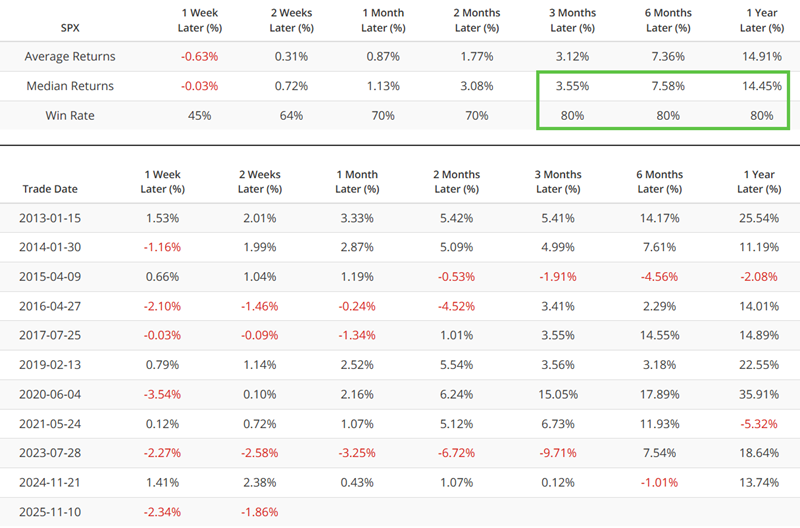
To refine results, the chart below only highlights only:
- The first cross above 85 within twelve months
- That occurs while the S&P 500 is above its 200-day moving average
Using these rules, the most recent signal occurred on November 10th.
The table below summarizes subsequent S&P 500 performance and signal-by-signal results.
What the research tells us…
The signals above are not ones that a person would typically use as a standalone trading strategy. Nevertheless, when used in the proper context, they can be extremely valuable. Continuation signals, such as those highlighted here, can serve as reaffirmations that the primary trend remains intact for longer-term investors. And shorter-term traders can view these signals as an opportunity to speculate on the long side of the market.