
More favorable breadth signals - if the market can hold

Key points
- The stock market continues to flash signs of an oversold condition; the concern is whether the primary trend can remain favorable
- Breadth in the Technology sector just triggered a potential sign
- Nasdaq new highs and lows have spent much of October in oversold territory
Oversold in perspective and the current state of affairs
Broadly speaking, an oversold condition in an existing uptrend can offer a terrific opportunity for investors and traders alike. The problem is that fear is often at its highest as a given oversold condition reaches an extreme, and the "existing uptrend" is often in question at the time the oversold condition peaks. The good news is that long-term investors do not need to buy the bottom of an oversold condition to benefit. By being patient and waiting for an oversold condition to diminish somewhat and confirming that an uptrend remains intact, investors may be able to put money to work when risk is at its lowest.
This brings us to the current state of affairs in the stock market. Various oversold-type indicators (primarily in the categories of breadth of sentiment) have flashed potentially favorable signals in the last month or so. This alerts investors to the potential for a buying opportunity. The problem is that a majority of major stock market indexes (including the S&P 500, Dow Industrials, and Dow Transports) have seen their longer-term uptrend challenged, while others (Dow Utilities and Russell 2000 small-cap Index) have been in outright downtrends.
The market appears to be at a crossroads. Many investors and pundits will pick a side and look for evidence to confirm their belief. A better suggestion might be to let the market tell you what it wants to do. If price continues to break down, it is reasonable to play some defense rather than to ride a significant bear market to the bottom fully invested. In the meantime, the plethora of oversold indicators witnessed in the last month - combined with favorable seasonality - suggests that investors give the bullish case the benefit of the doubt a little longer.
XLK breadth is sending a signal
As the name implies, this indicator shows the percentage of stocks in the Technology Select Sector SPDR Fund ETF (ticker XLK) currently trading above their 10-day moving average. This is a breadth figure, so we can see the participation among fund members. The underlying breadth will often diverge positively (at bottoms) or negatively (at tops) from the index at turning points.
It is also helpful to monitor extremes in the breadth figures. When so many components of an index are doing well or poorly, we usually see the index make a counter move in the days, weeks, or months following the extreme.
The chart below highlights those dates when the XLK Breadth (% > 10-day Avg) indicator dropped below 3 for the first time in 5 days while ticker XLK was above its 150-day moving average.
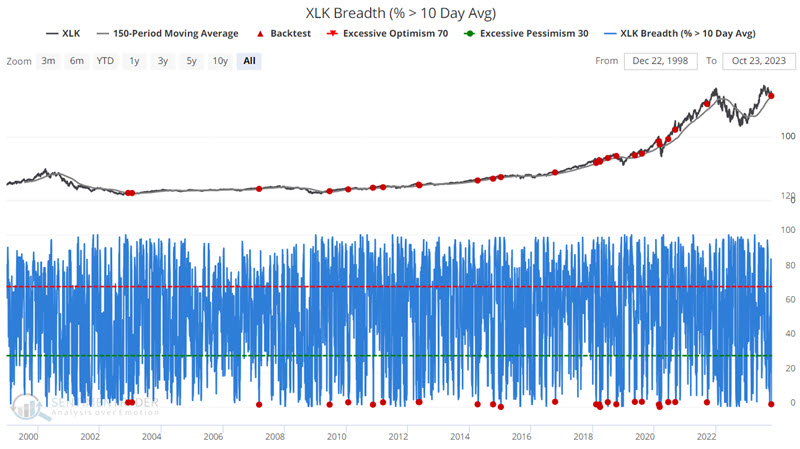
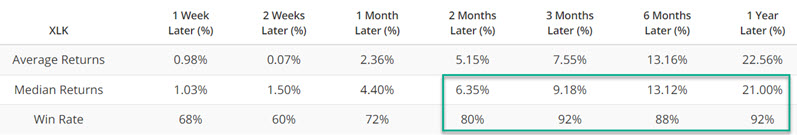
The table below summarizes the subsequent S&P 500 Index performance.
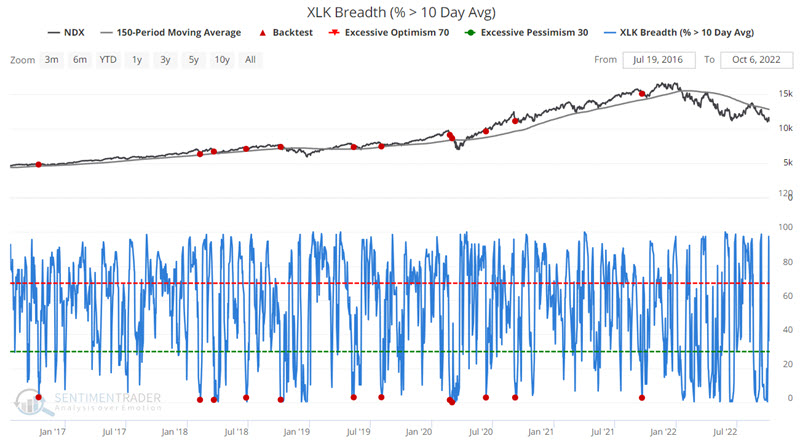
To take a slightly broader approach, we will run the same test using the same indicator but will test results using the Nasdaq 100 Index (ticker NDX). The chart below highlights those dates when the XLK Breadth (% > 10-day Avg) indicator dropped below 3 for the first time in 5 days while ticker NDX closed above its 150-day moving average.
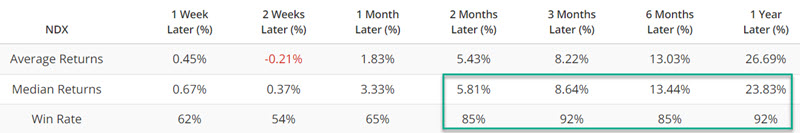
 The table below summarizes the Nasdaq 100 Index performance.
NASDAQ High/Low Logic Index
The HiLo Logic Index was created by Norman Fosback in 1979. Intended to observe "split" market conditions, it looks for times when there are many 52-week highs AND 52-week lows among securities on the exchange. When there are a lot of both, the market is severely split between winners and losers, and it tends to be negative for stocks. When there is a very low number, the market is heavily one-sided, which tends to be a positive for stocks.
The chart below highlights those dates when the 5-day average of the NASDAQ High/Low Logic Index crossed below 0.605 for the first time in six months while the Nasdaq 100 Index was above its 150-day moving average. The most recent signal occurred on 2023-10-06.
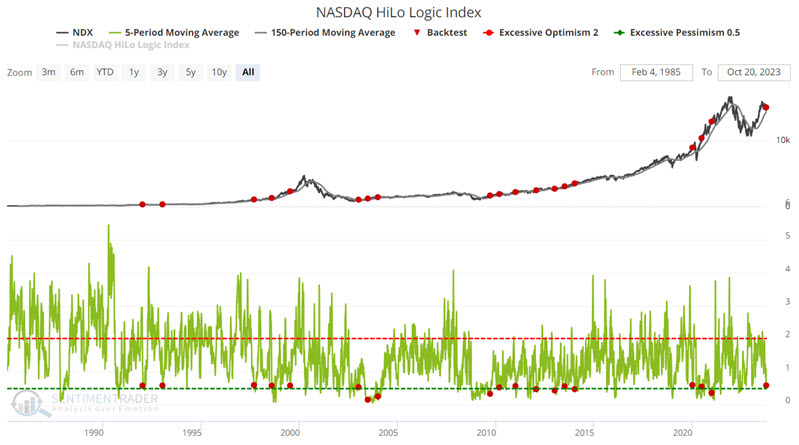
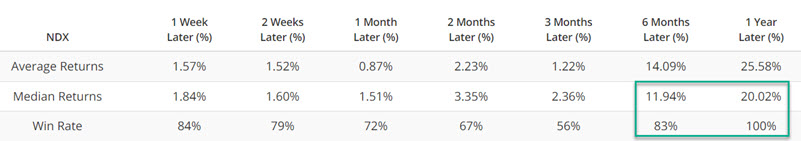
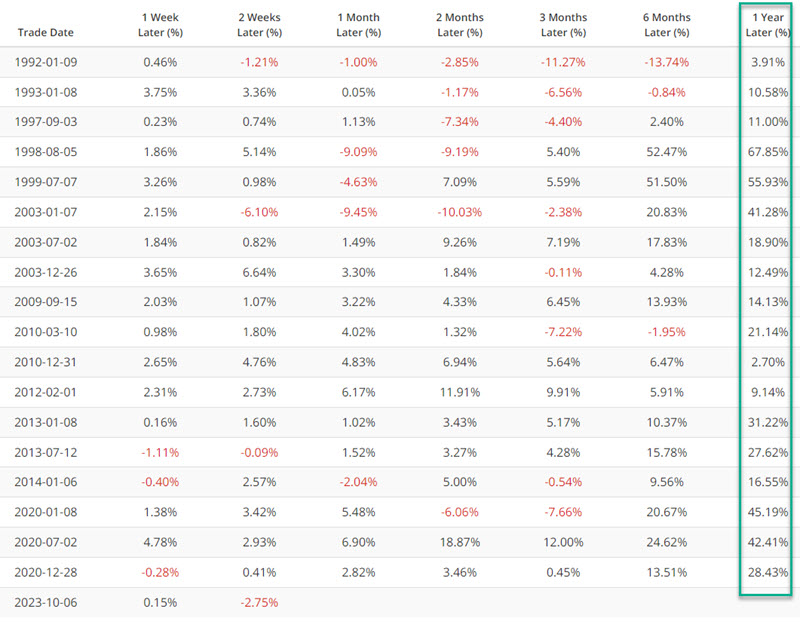
The good news is that the twelve-month Win Rate is 100%, with a Median Gain of 20%. The bad news is that it is always a mistake to assume that a historical 100% Win Rate implies that any new signal will automatically be followed by smooth sailing. For the record, the Nasdaq 100 Index is still 2% below its level of the last signal date in early October.
What the research tells us…
No indicator or combination of indicators is ever infallible. Macroeconomic conditions and geopolitical events can cause significant disturbances in the financial markets. That said, the primary reason for focusing on objective indicators is to remove the emotion that generally accompanies these conditions and events. While caveats certainly apply, the items highlighted in this piece appear to suggest that investors be looking closely for a buying opportunity - particularly if price action stabilizes.