
More evidence of a recovery around the globe

Key points:
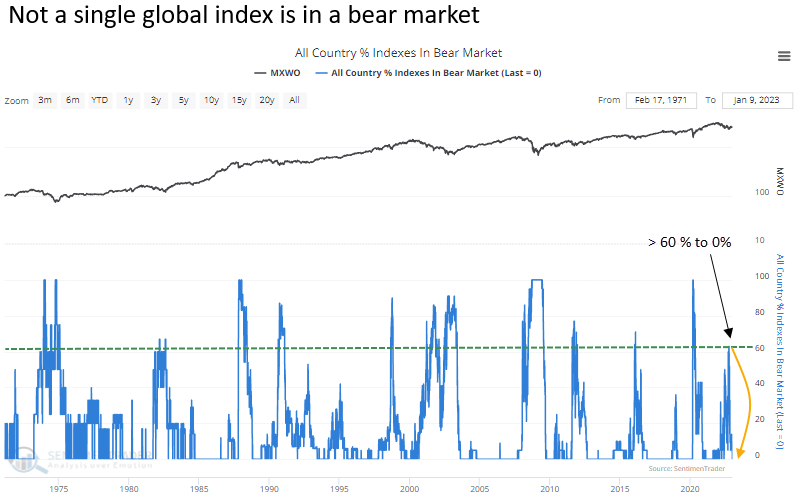
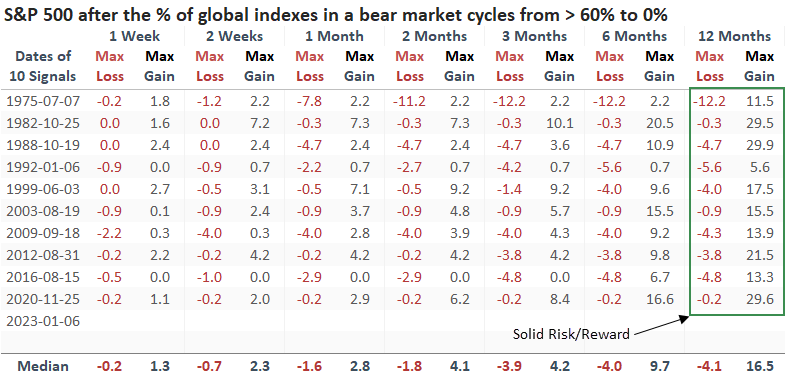
- The percentage of global indexes in a bear market cycled from > 60% to 0%
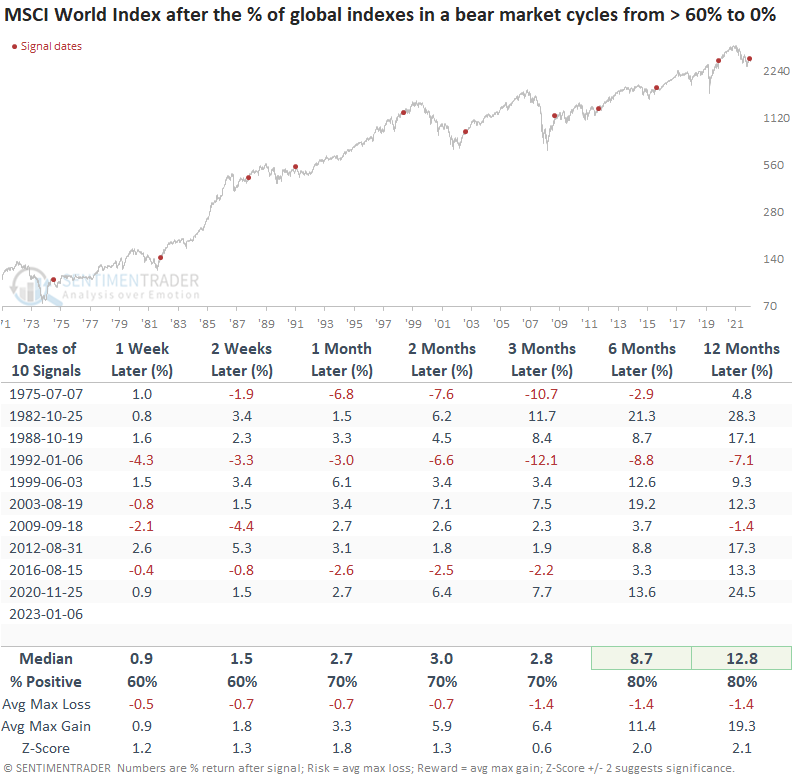
- After similar reversals, the MSCI World Index was higher 80% of the time a year later
- Applying the signals to the S&P 500, the Index was higher 100% of the time a year later
A synchronized recovery around the globe bodes well for stocks
Global Indexes continue to recover from the depths of the 2022 drawdown, with internal and external measures of price behavior reversing higher or lower depending on the particular indicator.
One such measure, the percentage of global indexes in a bear market, cycled from > 60% to 0% for only the 11th time since 1972.
Similar reversals preceded excellent long-term results
When the percentage of global indexes in a bear market cycles from > 60% to 0%, the MSCI World Index tends to rally, with the best results occurring six to twelve months later. The signal was positive at some point in the next twelve months in 9 out of 10 cases.
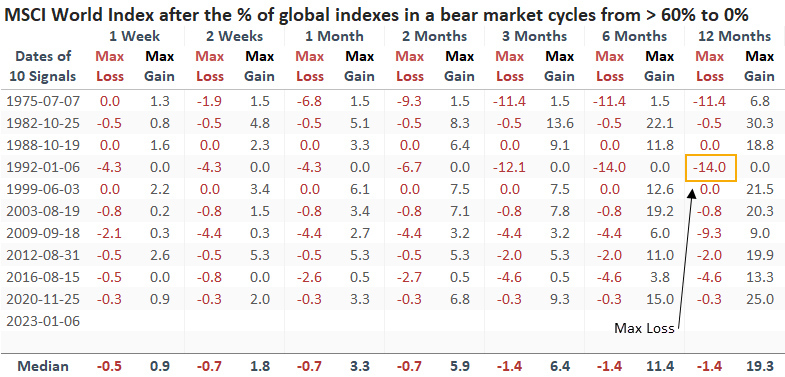
The max loss at any point in the first year is relatively benign, with a -14% drawdown. And, 7 out of 10 signals a year later showed a significantly better max gain when compared to the max loss.
When I apply the signals to the S&P 500, the results look even more impressive than the MSCI World Index, with a 100% win rate a year later. And drawdowns were once again somewhat minimal.
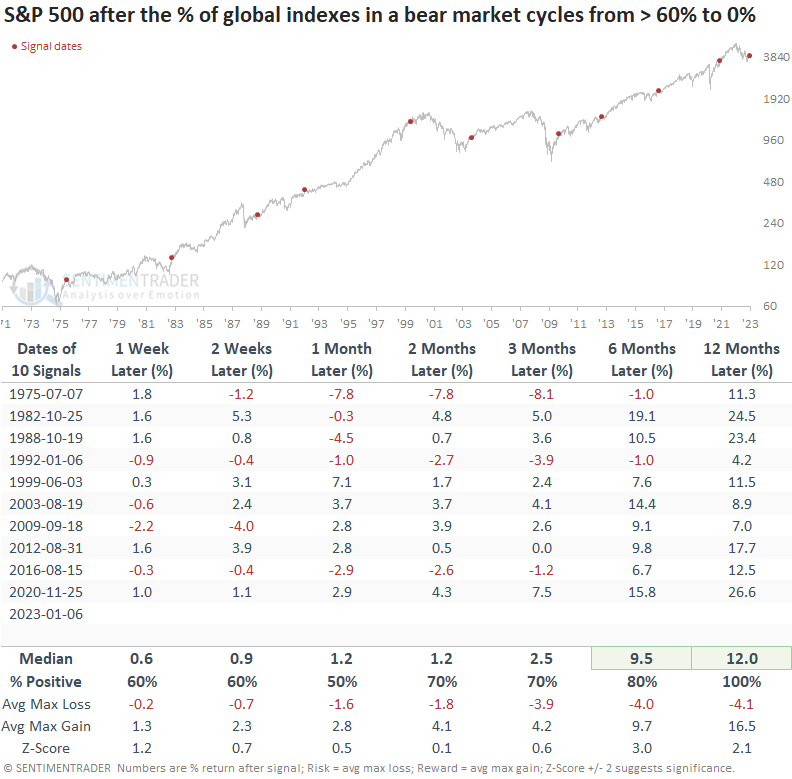
After all but one of the signals, the Index enjoyed a more significant maximum gain than maximum loss over the next twelve months.
Where should we be looking for ideas around the globe
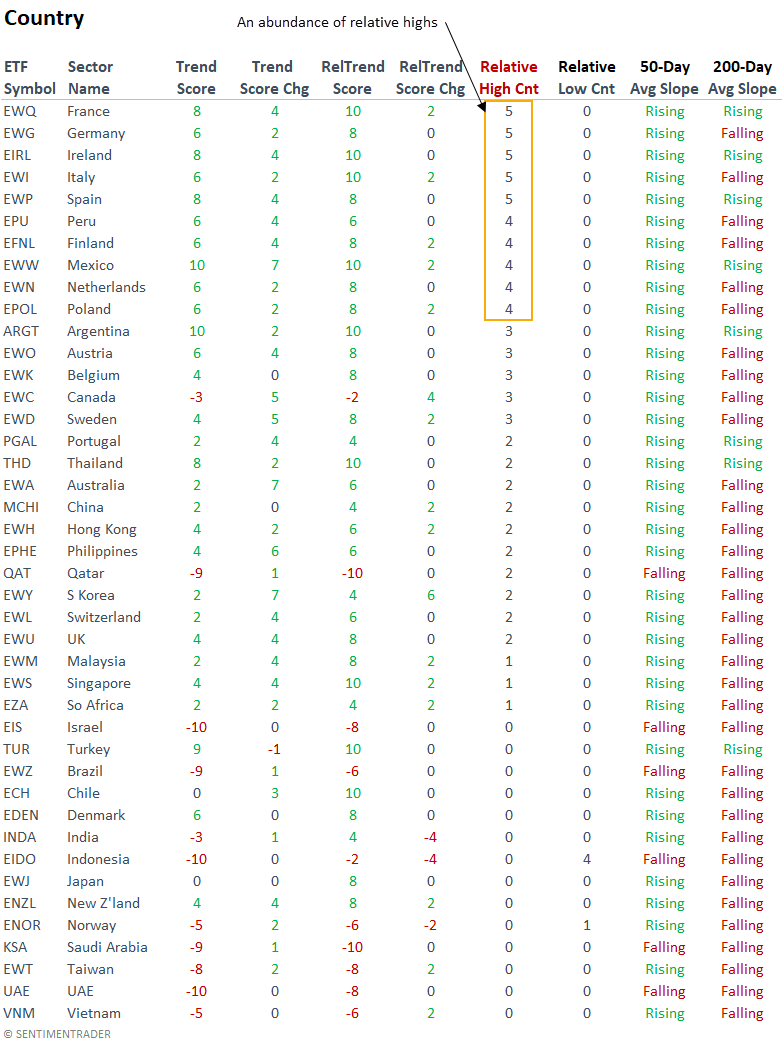
The recovery in absolute and relative trends, which I highlighted in a note last week, continues to improve. Over the last week, several countries registered a 21-day relative high versus the S&P 500 every single day. And the bulk of the breakouts is coming from the Eurozone.
What the research tells us...
While the macroeconomic backdrop remains challenged, stocks around the globe continue to recover from the depths of the 2022 drawdown as value-oriented indexes are driving the improvement. When the percentage of global indexes in a bear market cycles from > 60% to 0%, the MSCI World Index and the S&P 500 enjoy solid long-term results with somewhat minimal drawdowns. Remember, it's a market of stocks, not a stock market.