
More continuation signals from insiders and IPOs

Key points
- The stock market remains constructive on a trend-following basis
- A variety of indicators have flashed "continuation" signals recently
- These signals suggest that investors continue to give the bullish case the benefit of the doubt
A quiet signal for NDX constituent corporate insiders
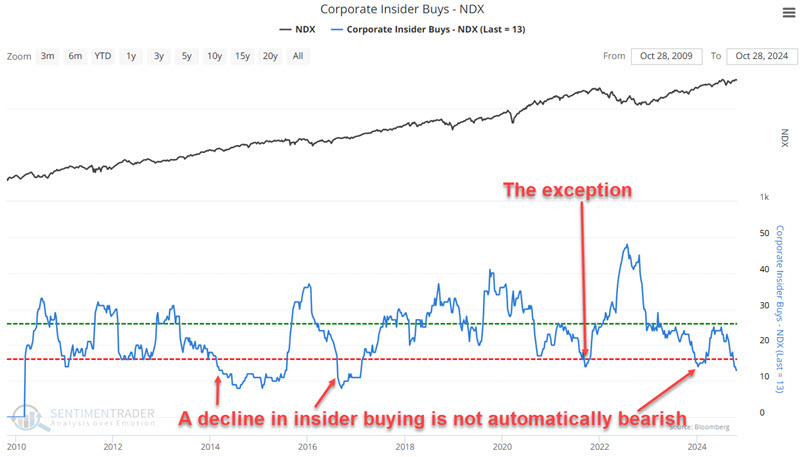
Bullish insider activity was everywhere, while the stock market bottomed out in 2022. Since then, insider activity has cooled off as the stock market continues to hit new highs. This is unsurprising as insiders have a long history of "loading up" during significant declines and becoming net sellers as the market advances.
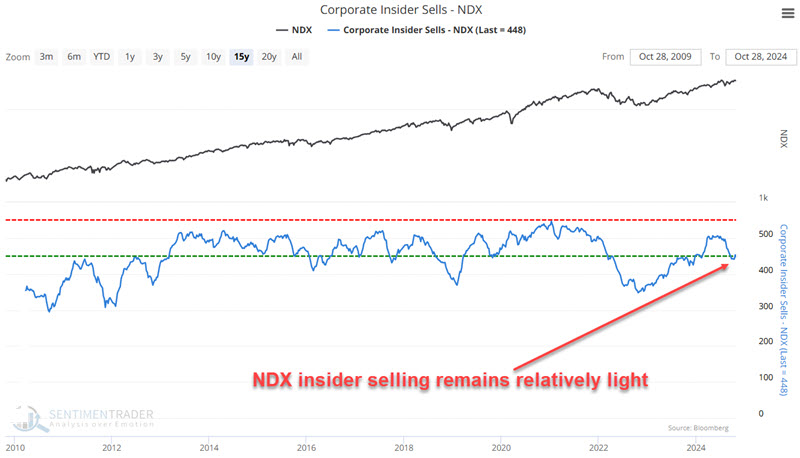
Regarding the 100 constituent stocks comprising the Nasdaq 100 Index (NDX), buying and selling have been on the low side recently. See the charts below.
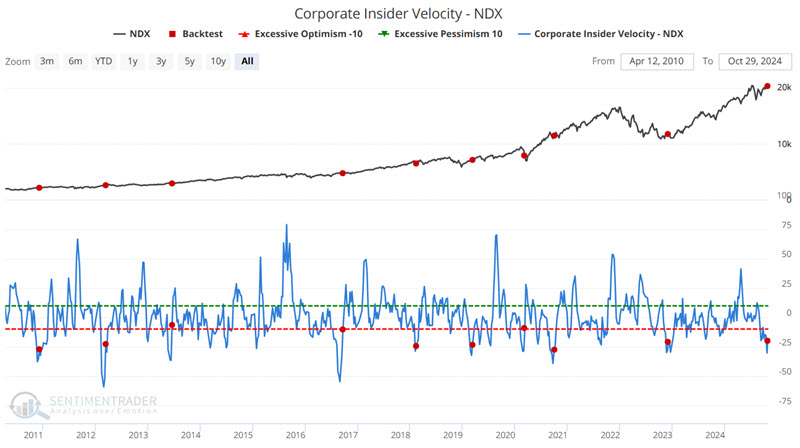
At first blush, there does not appear to be much valuable information to glean from NDX's insider activity. Enter our Corporate Insider Velocity - NDX indicator. This indicator shows the velocity of corporate insider buying versus selling in Nasdaq 100 stocks. It takes a 4-week rate of change for insider buys and subtracts a 4-week rate of change for insider sales.
Generally, the more positive the difference, the more that insiders are buying their stock and the more positive it is for the market. The lower the difference, the more intensely they are selling their stock, and the worse it is for the market. However, another helpful iteration looks for reversals in the indicator value from a low level as a somewhat "hidden" signal of a potential shift in insider action.
The chart below highlights the dates when our Corporate Insider Velocity-NDX indicator crossed above -28 for the first time in six months. The most recent signal occurred on 2024-10-28.
The table below displays signal-by-signal performance for the Nasdaq 100.
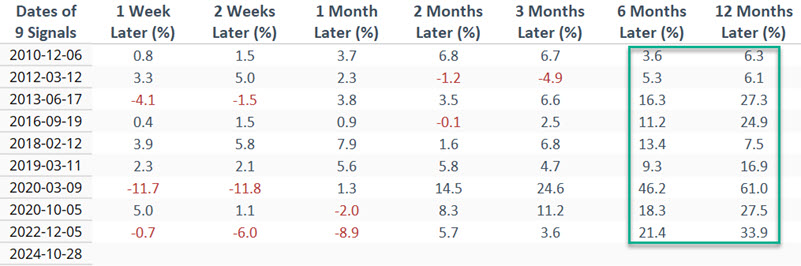
The table below summarizes the results.
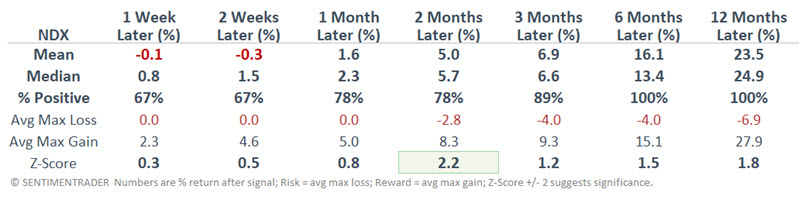
There are a few key things to note. On the positive side, it is hard to ignore the 100% Win Rates for six and twelve-month returns and the exceptional Median Returns. On the other hand, the sample size is admittedly small (only nine previous signals), and Z-Scores do not jump off the page. So, one can argue that results are highly influenced by the primarily bullish action of the Nasdaq 100 over the past 15 years.
With all that said, I do not consider this an automatic "buy" signal. However, I place it firmly on the favorable side of the weight of the evidence ledger and interpret it as suggesting that investors continue to give the bullish case the benefit of the doubt.
IPO / S&P 500 Relative Ratio Rank indicator flashes a favorable sign
Our IPO / S&P 500 Relative Ratio Rank indicator compares the performance of an IPO (Initial Public Offerings) Index to the performance of the S&P 500 Index. The indicator shows where the ratio is relative to its range over the past four months. When the relative ratio is high, investors are showing risk-on behavior. When the ratio drops to a low level, they exhibit risk-off behavior. Risk-on behavior leads to more buying and, thus, higher stock prices.
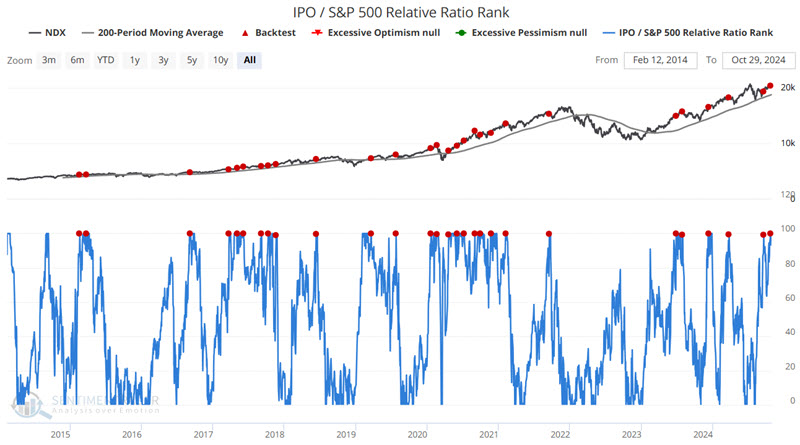
This indicator can be useful as a "continuation" signal in an ongoing bull market. The chart below highlights all dates when the indicator crossed above 99 for the first time in one month while the Invesco QQQ Trust (QQQ) was above its 200-day moving average. The most recent signal occurred on 2024-10-22.
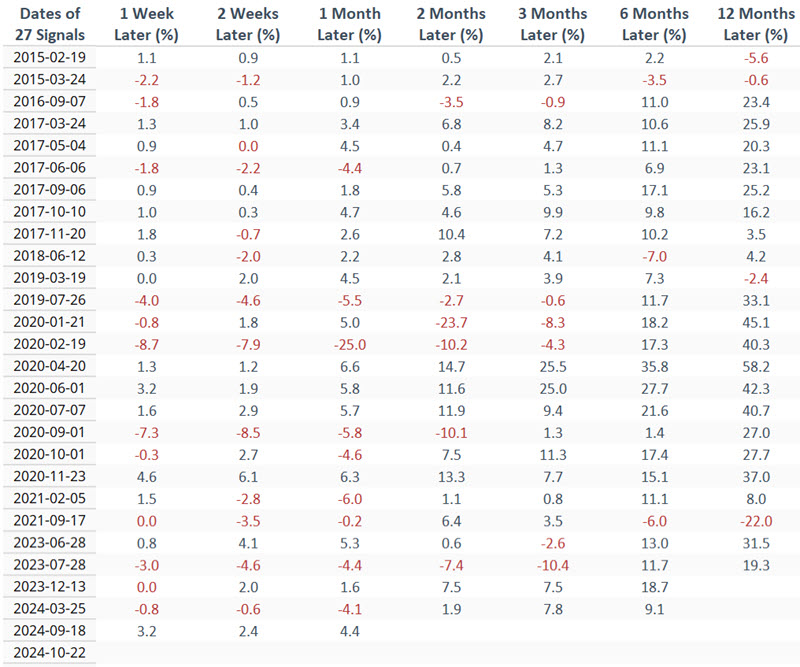
The table below displays signal-by-signal performance for the Nasdaq 100.
The table below summarizes the results.
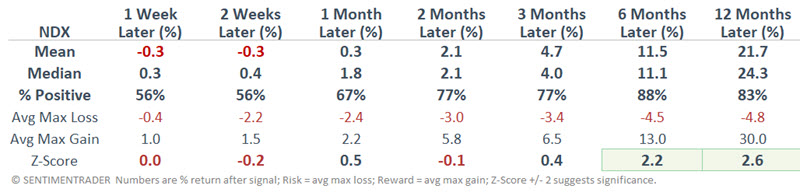
Overall, this signal has been useful in helping to identify additional buying opportunities in an ongoing bull market.
What the research tells us…
It is helpful to remember my three rules about indicators:
- Not every indicator is meant to serve as a standalone trading system
- Not every "squiggle" of every indicator value "means something"
- Not every "signal" from every indicator is meant to be an "automatic" buy or sell signal
These rules apply well to the two indicators highlighted above. The recent signals do not guarantee that the stock market will continue to rally, nor that the Nasdaq 100 will automatically be trading higher six to twelve months from now. The signals do, however, add significant weight to the favorable side of the "weight of the evidence" ledger and - in the absence of contrary evidence - strongly suggest that longer-term investors continue to give the bullish case the benefit of the doubt and that shorter-term traders continue to focus on the long side of the market.