
More clues emerge from corporate insider actions

Key Points
- Corporate insiders know their companies' prospects best; following their lead is typically wise
- Insiders in the technology and financial sectors continue to favor the buy-side
- Selling among S&P 500 constituent insiders has fallen below a level that has generally been favorable in the past
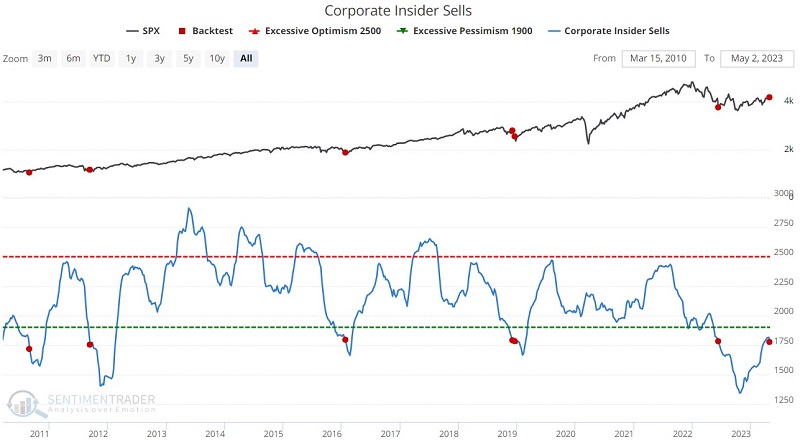
An absence of selling among S&P 500 corporate insiders
Buying shares of their own company in the open market with their own money (i.e., not just exercising stock options gifted to them as a form of compensation) is the most bullish thing a corporate insider can do. However, a lack of selling by insiders can also be a favorable sign. There are many reasons an insider may sell shares of stock. Sometimes these reasons are based on their outlook for the company and the industry, but other times it is not. The bottom line: if insiders are holding their shares (i.e., not selling them to cash out), it typically means they expect the price of those shares to move higher ultimately.
The chart below shows the total number of corporate insiders of S&P 500 companies that have sold shares on the open market during the past six months. The red dots highlight those times when the value crossed below 1,800.
The table below summarizes S&P 500 performance following the dates highlighted in the chart above.
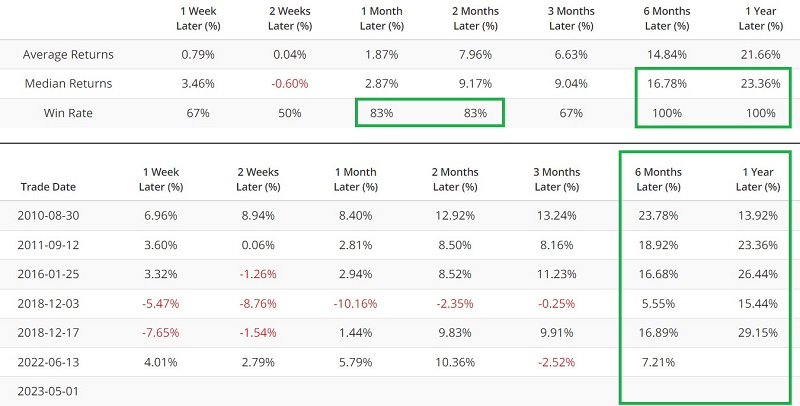
Insider buying and selling indicators are generally best not to be considered "timing" tools - as insiders often act early. Nevertheless, this test's handful of signal dates have previously occurred conspicuously close to market bottoms. There is no guarantee that will be the case this time around, but it is a reason for optimism.
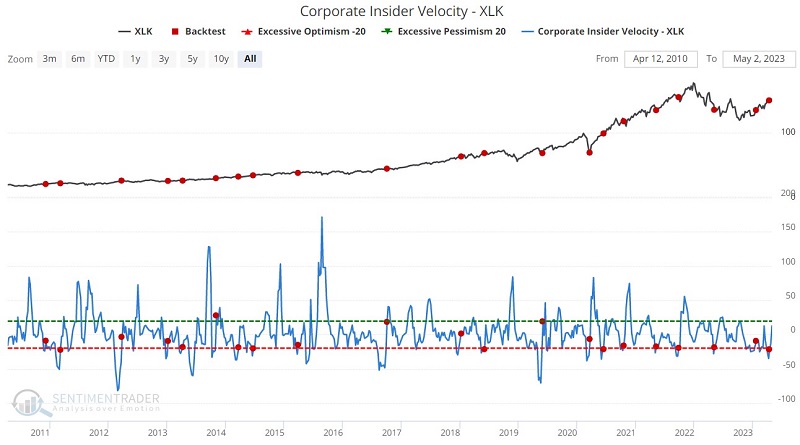
Technology insiders still favor the buy-side
The Corporate Insider Velocity - XLK indicator shows the velocity of corporate insider buying versus selling in the Technology Select Sector SPDR ETF (ticker XLK) stocks. It takes a 4-week rate of change for insider buys and subtracts a 4-week rate of change for insider sales. Upside reversals for this indicator can highlight times when tech insiders shift from selling to buying.
In the chart below, the red dots highlight when this indicator has crossed above 0.23 for the first time in three months.
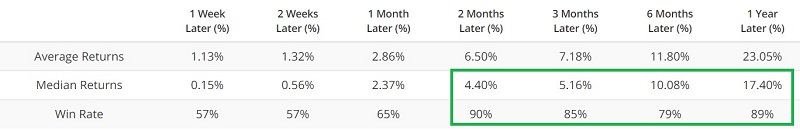
The table below summarizes XLK's performance following the dates highlighted in the chart above.
Financial insiders see bargains
The bank collapses in recent months have understandably heightened concerns in the financial sector. So far, however, one group of investors who have not panicked are the corporate insiders in the financial sector. Based on their collective actions in the open market, financial sector insiders appear to be treating the selloff in financial stocks as a buying opportunity.
As stated earlier, insiders, on the whole, can often be early. So the decline could easily get worse before it gets better. But insiders are also rarely wrong when they act in concert. Thus, the continued pick up in buying relative to selling appears to be a positive sign for the financial sector for the next one to three years.
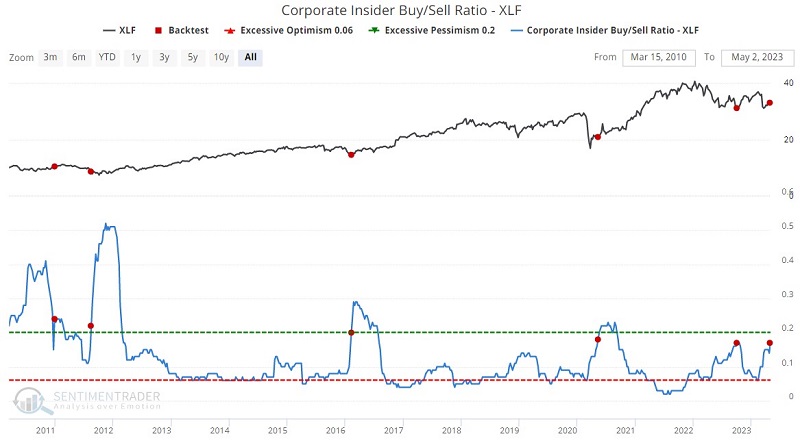
The Corporate Insider Buy/Sell Ratio - XLF indicator shows the total number of corporate insiders of companies covered by the XLF ETF that have bought shares on the open market during the past six months versus those that have sold shares.
In the chart below, the red dots highlight when this indicator has crossed above 0.17.
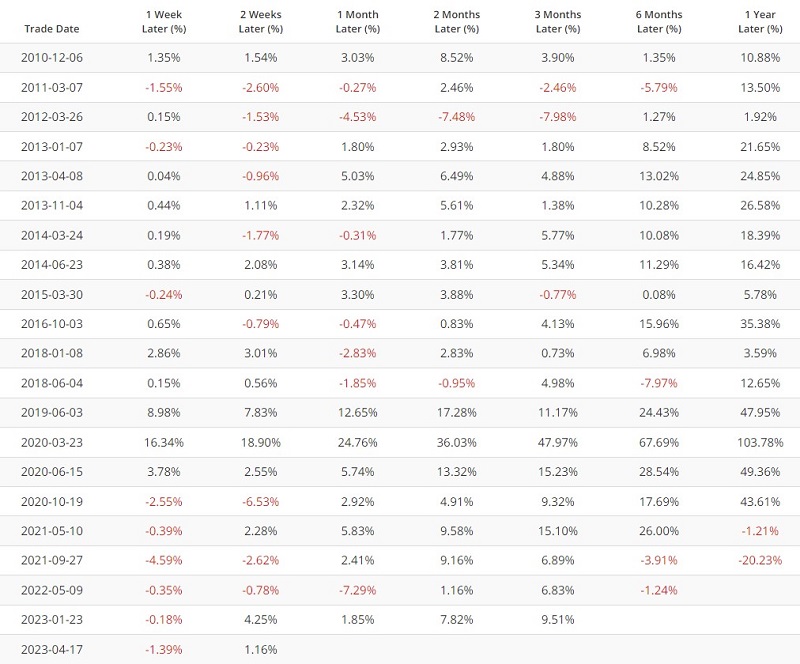
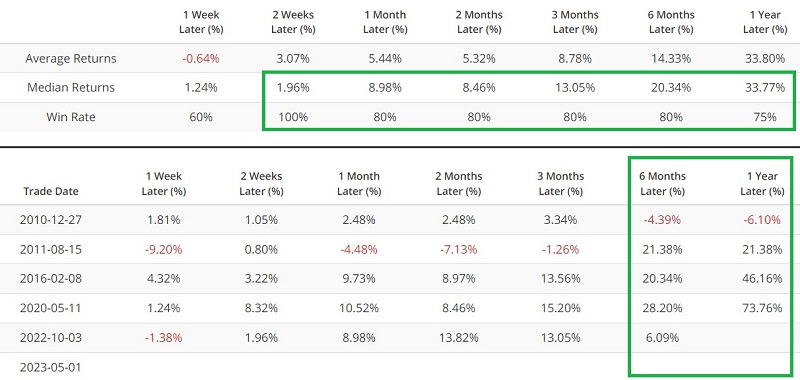
The table below summarizes XLF's performance following the dates highlighted in the chart above.
What the research tells us…
No one knows their companies' fundamental prospects better than corporate insiders. When they collectively express a strong opinion in the open market, it is typically best to pay attention. The recent favorable insider action highlighted above does not guarantee that the stock market - or any given sector - will not fall in the near term. Nevertheless, bullish insider action - particularly in a troubled sector, such as financials - is generally one of the best reasons to ignore the headlines and look for opportunities in the stock market.