
More Breadth Related Warning Signs Appear

Key points
- Breadth-based warning signs continue to flash for stocks
- The Nasdaq Hi/Lo Logic Index and our own Nasdaq Titanicburg indicator are both suggesting "churning" in the market
- For now, these signals do not necessarily portend impending doom for the stock market; They amount to a warning sign that the stock market may become much more volatile in the year ahead, and that upside progress may be harder to come by than it has in the last six months
Nasdaq Hi/Lo Logic Index crosses a notable threshold
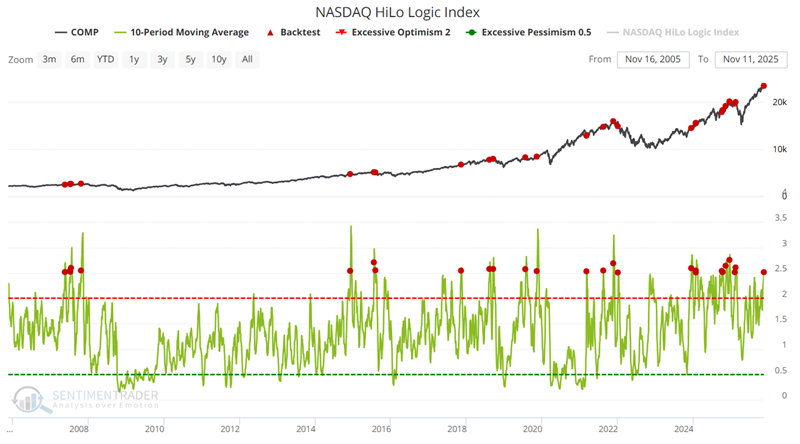
The original NYSE HiLo Logic Index was created by Norman Fosback in 1979. Intended as a way to observe "split" market conditions, it looks for times when there are both a large number of 52-week highs AND 52-week lows among securities on the exchange. When there are a lot of both, the market is severely split between winners and losers, and it tends to be a negative for stocks. When the number is very low, the market is heavily one-sided, which tends to be positive for stocks. The indicator is traditionally interpreted over a longer time frame, so we suggest viewing it with a 10-day moving average.
For our test, we apply the same concept to Nasdaq data and use the Nasdaq Composite Index (COMP) as our broad measure of OTC stocks. The chart below highlights all dates in the last 20 years when the NASDAQ Hi/Lo Logic Index 10-day average crossed above 2.5.
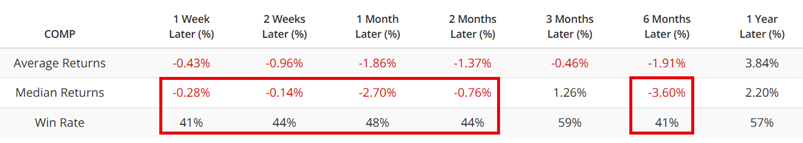
The first table below summarizes COMP performance following the signal dates highlighted in the chart above.
Now compare the results above to those below for all dates in the last 20 years. The table below summarizes COMP performance following all dates in the previous 20 years.
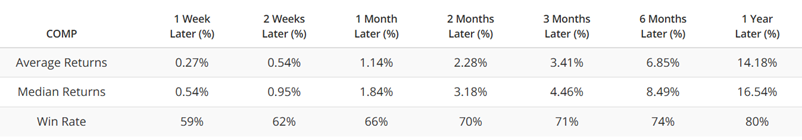
Several key points are worth noting from the tables above. First, overall performance following 10-day > 2.5 signals has been notably below average, with a lower Win Rate and Median Return across all time periods shown above.
The other thing to note is that the overall message is not necessarily "SELL EVERYTHING", but rather "Adjust your expectations and prepare mentally and portfolio-wise for a) a period of potentially much higher volatility and/or b) an extended period of sideways to lower price action."
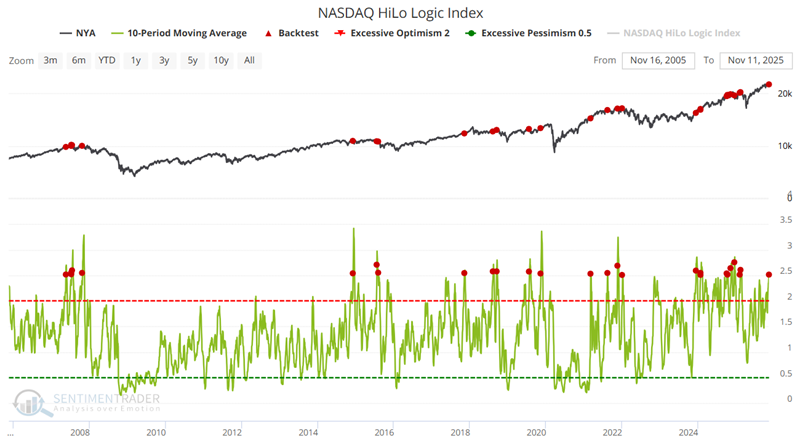
While the signal above is based on Nasdaq High/Low data, for illustrative purposes, let's apply the signals above to the broadest measure of NYSE action, the New York Stock Exchange Composite Index (NYA).
The chart below highlights all dates in the last 20 years when the NASDAQ Hi/Lo Logic Index 10-day average crossed above 2.5, but uses NYA as the underlying index for measuring subsequent stock market performance.
The first table below summarizes NYA performance following the signal dates highlighted in the chart above.
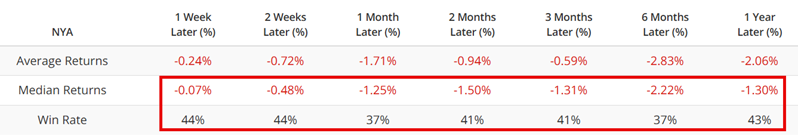
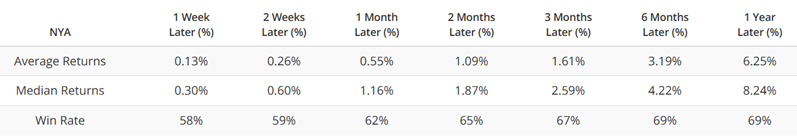
The table below summarizes NYA performance results for all dates in the last 20 years.
Once again, it is important to note a) the strong tendency for below-average results (Win Rates below 50% and negative Median Returns across the board), b) BUT that a signal does not mean that the stock market is automatically going to crash or tumble into a significant bear market.
The key takeaway is to adjust one's thinking not to expect the next 6-12 months to look like the last 6-12 months.
The NASDAQ Titanicburg is also flashing a warning sign
Our NASDAQ Titanicburg is a composite indicator that merges the NASDAQ Titanic Syndrome indicator with the NASDAQ Hindenburg Omen indicator. Higher readings on the NASDAQ Titanicburg signal unfavorable market conditions, while lower values are considered more favorable. This indicator incorporates both the Nasdaq Titanic Syndrome and NASDAQ Hindenburg Omen signals into a single metric.
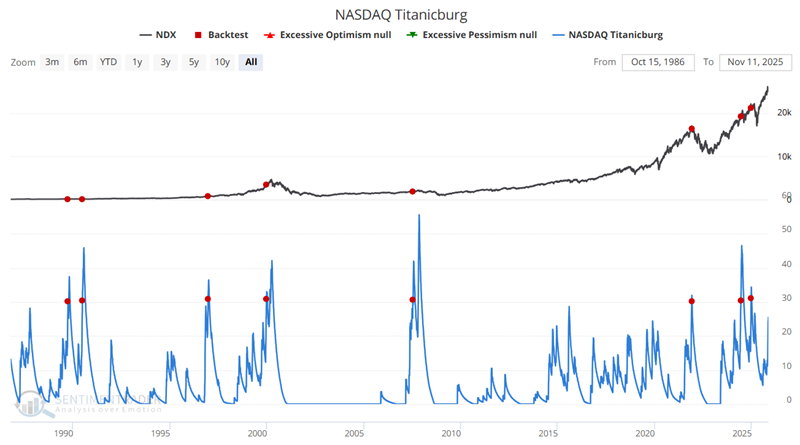
The chart below highlights all dates when the NASDAQ Titanicburg was above 20.
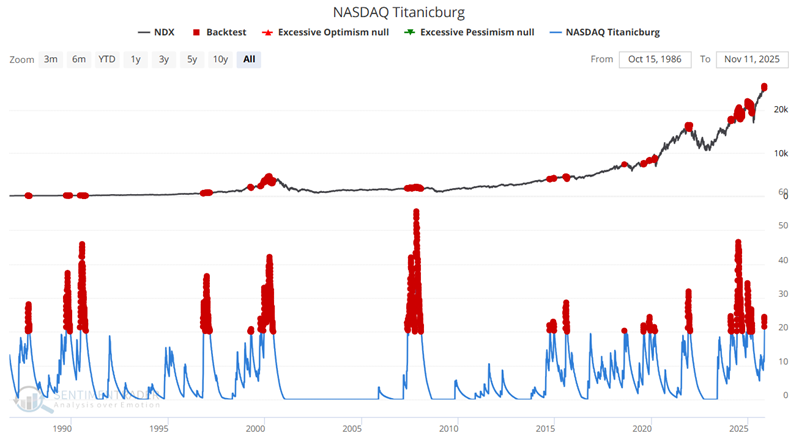
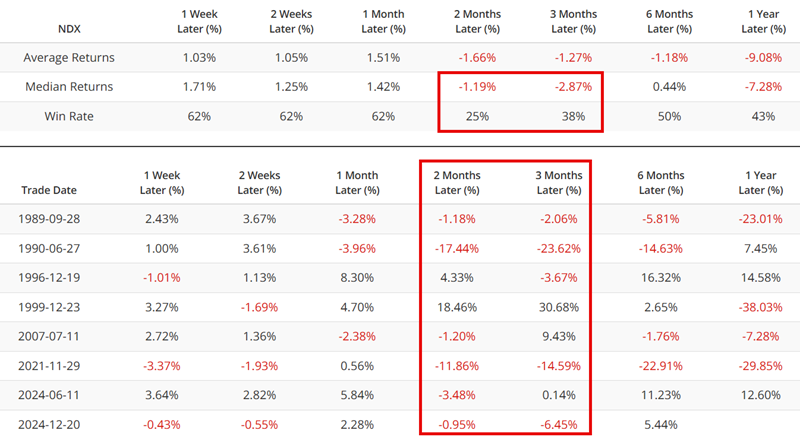
The table below summarizes the Nasdaq 100 Index (NDX) performance following the dates highlighted above.
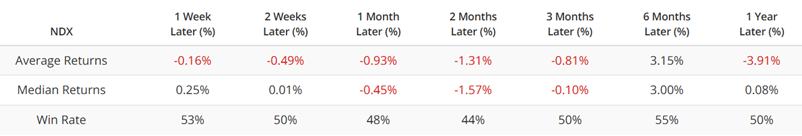
Once again, the message is less ‘Sell Everything" and more "Adjust your expectations and prepare for more volatility and chop."
I think you should keep an eye on the NASDAQ Titanicburg indicator, in case it continues to rise. Historically, the higher it goes, the more dire the warning sign. For example, the chart and table below highlight NDX performance following all dates when the NASDAQ Titanicburg crossed above 30 for the first time in six months.
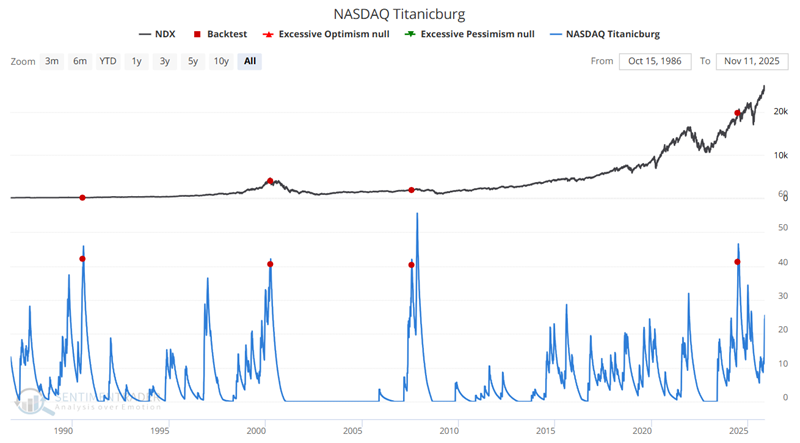
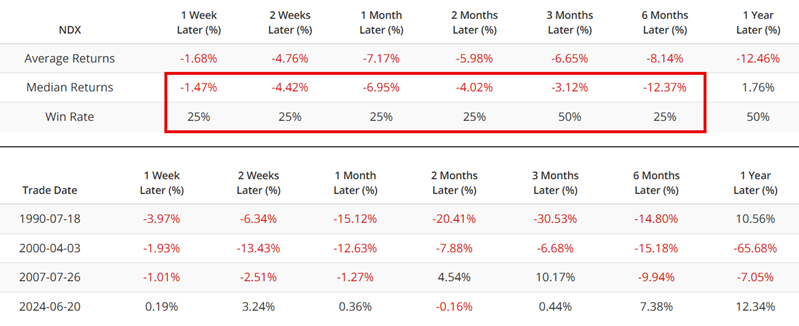
To take it to an even more extreme level, the chart and table below highlight NDX performance following all dates when the NASDAQ Titanicburg crossed above 40 for the first time in six months.
What the research tells us…
The indicators highlighted here are not intended to be used as a standalone trading model, but rather as a weight of the evidence indicators.
The good news is that none of the signals above are automatic "sell" signals, and there are instances when the stock market performed very well in the future despite any warning signs from the Hi/Lo Logic or Titanicburg indicators.
The stock market has enjoyed a massive rally since bottoming out in April 2025. After such an advance, it is common for a majority of investors to become complacent and expect that type of performance to continue. Historically, it typically does not. The signals highlighted above should not be viewed with a sense of panic or dread. They merely alert you to the possibility that the stock market may get much more volatile in the months ahead, and that making money may become more difficult, and that you should adjust your thinking - and possibly your portfolio - accordingly.