
More and more stocks are entering a bear market

Key points:
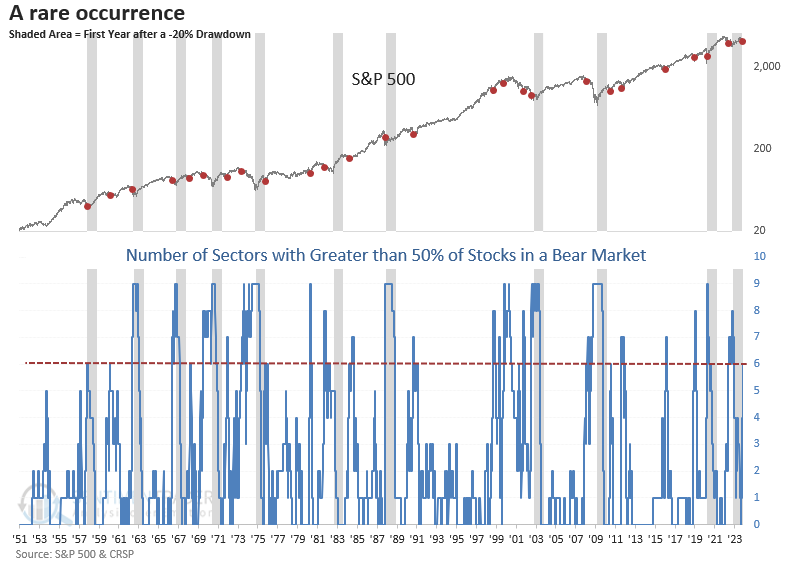
- The number of sectors with more than 50% of their respective stocks in a bear market increased to six
- Similar conditions indicate a market that's approaching an oversold status, setting the stage for a bounce
- After the count reaches six, slightly more than two-thirds of the signals bottomed within three months
The first significant pullback in a new bull market or something else
My colleague, Jay Kaeppel, published a research note last week highlighting the rising number of Industry Groups in a bear market as an indication of an oversold market condition. The indicator calculates the percentage of 23 sub-industry groups down -20% from a 52-week high, which measures external price action at the index level.
Similarly, we calculate the percentage of stocks in sectors that are down -20% from a 52-week high, which measures the internal price action from individual stocks.
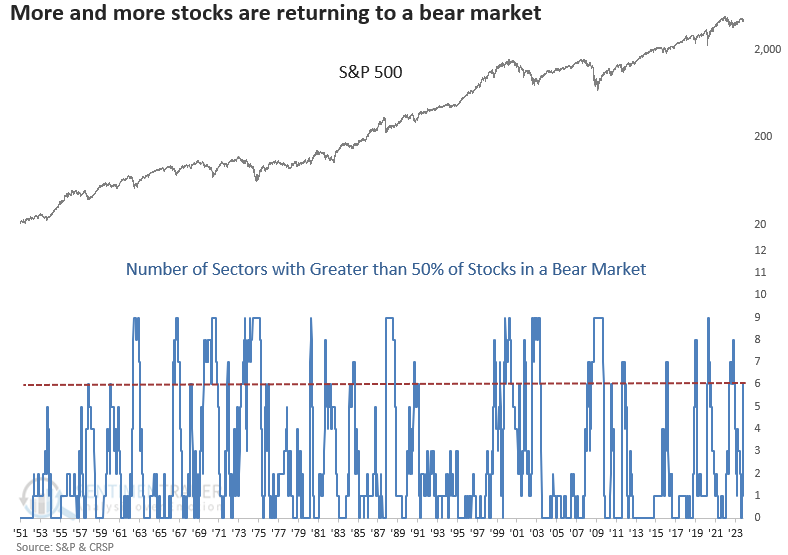
With the S&P 500 declining from its 1-year high, more and more stocks are joining the bear market ranks, highlighting the structural weakness under the surface of the world's most benchmarked index.
For the first time since the 2022 bear market, six out of nine sectors have over 50% of their respective stocks down more than -20% from a 52-week high.
It shouldn't come as a surprise to see defensive sectors with more than 50% of stocks in a bear market, as the team highlighted the price deterioration in those groups in several notes. Recently, Consumer Discretionary, Financials, and Materials joined the list of sectors, with a majority of stocks down -20% or more from a 52-week high.
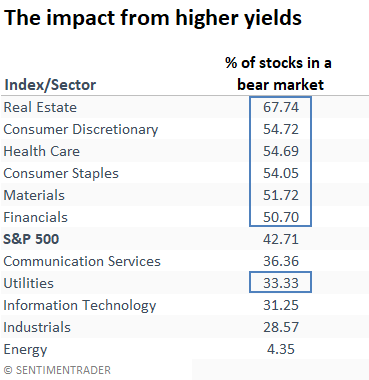
The composite that measures the number of sectors with greater than 50% of stocks in a bear market uses a 20-day lookback. So, the utility sector counted as one of the six groups prior to its recent improvement. I exclude real estate and communications services because both sectors have limited data.
Similar oversold conditions suggest a potential bounce
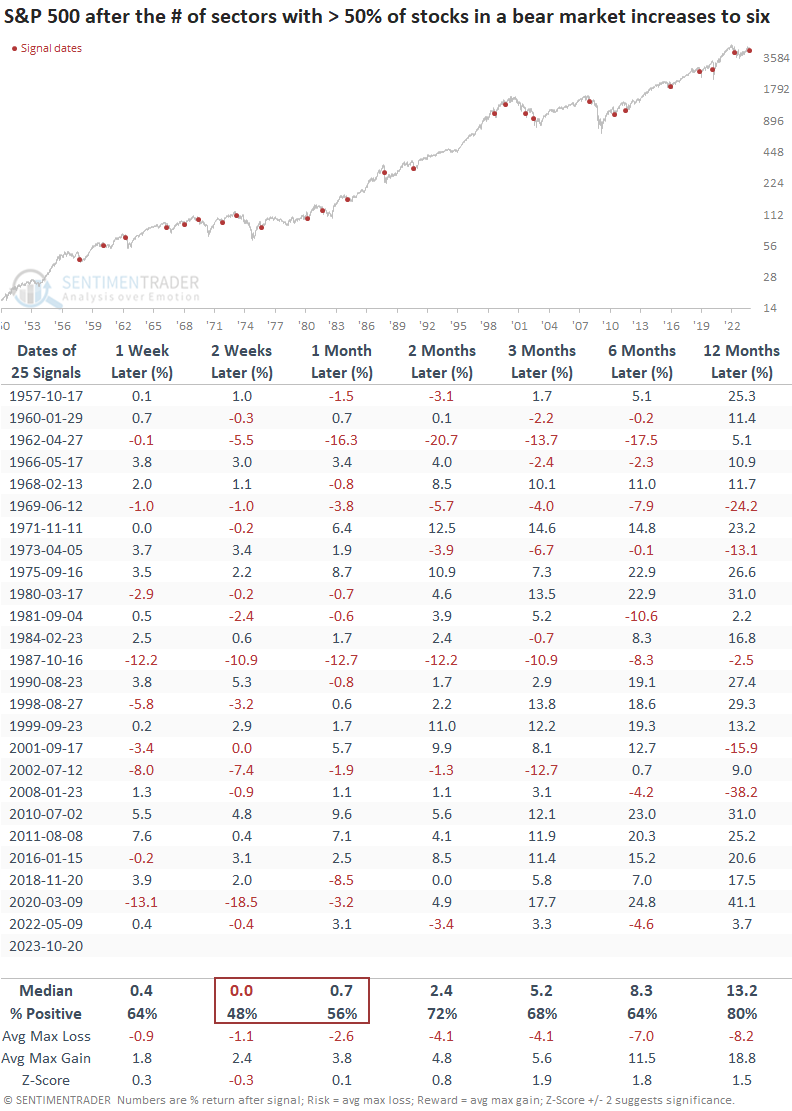
When six sectors show 50% or more of their respective stocks in a bear market, the S&P 500 is somewhat soft over the subsequent month, with below-average win rates in the two and four-week horizons. And, within the first month, the S&P 500 was lower at some point in 18 out of 25 cases.
After the bottoming process, the world's most benchmarked index tends to bounce at the two-month horizon. Except for extended bear markets, results are reasonably solid a year later.
Some further considerations
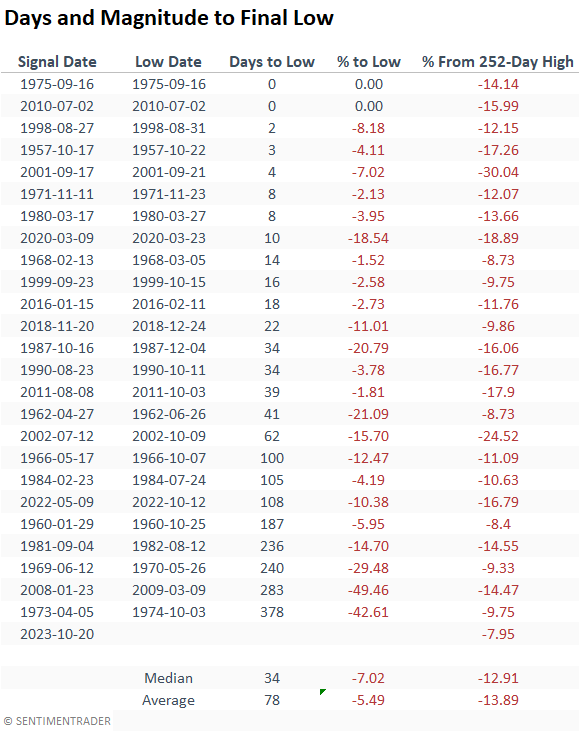
After the count reached six, nearly half of the signals hit their lowest point within a month, and slightly over two-thirds did so within three months. Nevertheless, for cases where the signals bottomed in the first month, the average and median losses extended to an additional -5.15% and -3.34% until the S&P 500 reached its final low.
Furthermore, it's worth noting that the most recent alert came at a time when the S&P 500 was down only -7.95% from its one-year high, representing the smallest drawdown from a peak. Usually, when the sector count expands to six groups, the S&P 500 is roughly -13% below the high. So, the mega-cap stocks within the S&P 500 are hiding the structural weakness under the surface of the index.
It's rare to see so many sectors with more than half of their stocks in a bear market a little over a year after a -20% drawdown in the S&P 500. Even more rare is the close proximity to the previous signal.
What the research tells us...
The number of S&P 500 sectors with greater than 50% of their stocks in a bear market increased to the highest level since the fall of 2022, suggesting structural weakness under the surface of the world's most benchmarked index. Similar oversold conditions indicate a potential bottom and multi-month rally. However, given the proximity to the previous signal and the first anniversary of the 2022 low, we need to keep an open mind to all possible outcomes.