
Monthly Anomalies You Are Probably Not Aware of (Part I)

This is Part I of a three-part series looking at unique seasonal anomalies in the stock market that most traders are not aware of.
Many traders want to know - understandably - "why" something works before they commit their hard-earned money to using whatever that something may be in their own trading. In all candor, those traders may not enjoy this particular piece. Because I cannot plausibly explain what I am about to discuss.
As a proud graduate of "The School of Whatever Works" (or as I call it, good ‘ole SWW) I am slightly less encumbered than many other traders and am comfortable dealing with anomalies and the potential rewards they might offer - while vigilantly maintaining a high degree of awareness regarding the potential associated risks.
So, let's look at a few "monthly anomalies" in the stock market.
Identifying "Trading Days"
First off, note that for this piece we will be counting back trading days from the end of the calendar month. As such:
- The last trading day of the month is designated as "TDM -1"
- The 2nd to last trading day of the month is designated as "TDM -2"
- And so on and so forth back to TDM -11
The table below illustrates the concept. Looking at December 2020, if we count the last trading day of the month as TDM -1, then by counting backwards we find that December 16th is TDM -11.
Date | Trading Day of Month (TDM) | TDM- |
12/1/2020 | 1 | -22 |
12/2/2020 | 2 | -21 |
12/3/2020 | 3 | -20 |
12/4/2020 | 4 | -19 |
12/7/2020 | 5 | -18 |
12/8/2020 | 6 | -17 |
12/9/2020 | 7 | -16 |
12/10/2020 | 8 | -15 |
12/11/2020 | 9 | -14 |
12/14/2020 | 10 | -13 |
12/15/2020 | 11 | -12 |
12/16/2020 | 12 | -11 |
12/17/2020 | 13 | -10 |
12/18/2020 | 14 | -9 |
12/21/2020 | 15 | -8 |
12/22/2020 | 16 | -7 |
12/23/2020 | 17 | -6 |
12/24/2020 | 18 | -5 |
12/28/2020 | 19 | -4 |
12/29/2020 | 20 | -3 |
12/30/2020 | 21 | -2 |
12/31/2020 | 22 | -1 |
The Period Under Consideration
For Part I the period will look at is:
- The single day of TDM -11 of every month
- We will look at 90 years of history from 12/31/1930 through 12/31/2020
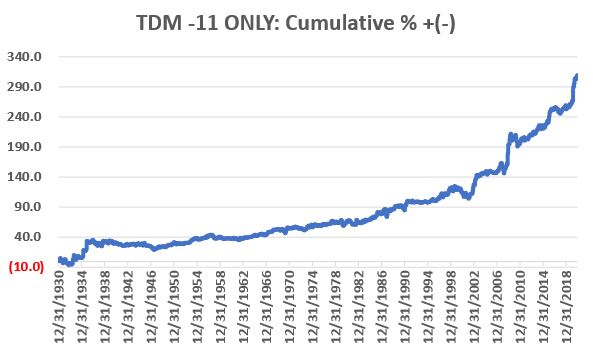
In other words, we will look at the performance of the S&P 500 Index if it were held for ONLY one day a month - the same day every month, i.e., the 11th to last trading day - during every month starting in January 1931
The figure below shows the cumulative % price gain for the S&P 500 Index held only during this one trading day per month (i.e., the 11th to last trading day of each month) over the full 90-year test period.
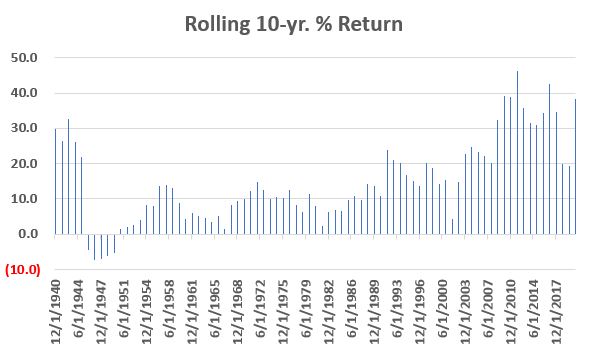
The chart below displays the 10-year rolling return for the same strategy. As you can see, results were stellar into the mid-1940's, then fell off for a few years. Every 10-year period that began after August of 1940 (and ending after 1950) has witnessed a gain.
Now let's compare ALL TDM -11 days versus all other trading days. The comparative numbers appear in the table below.
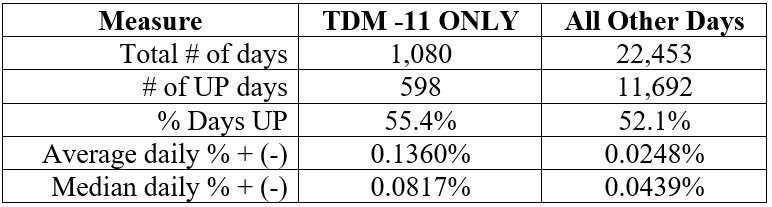
Note from the table above:
- TDM -11 is UP 55.4% of the time versus 52.1% for all other trading days
- The average daily % +(-) for TDM -11 (+0.1360%) is 5.5 time greater than the average for all other days (0.0248%)
- The median daily % +(-) for TDM -11 (+0.0817%) is 1.9 time greater than the median for all other days (0.0439%)
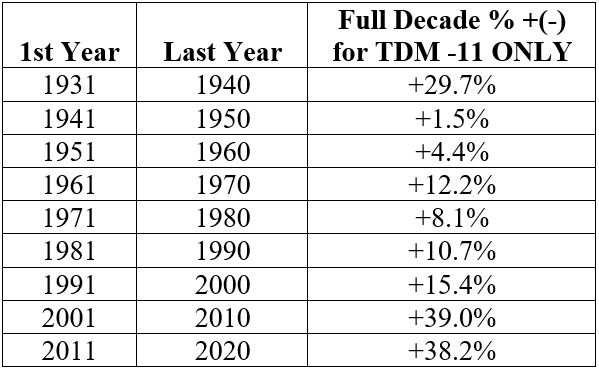
Finally, the table below looks at 10-year returns strictly at the end of each decade. The key thing to note is that the S&P 500 Index on Trading Day # -11 - on a standalone basis - showed a gain in every decade.
Summary
The problem with this information is that of course on a standalone basis it involves being in the stock market only 12 trading days a year, resulting in too much missed opportunity. From a practical trading point-of-view the information presented here suggests that investors might pay slightly closer attention to when they buy or sell - for example a trader looking to buy might want to get the trade done prior to TDM -11 while a trader looking to sell might considering waiting until after.
The primary purpose of highlighting this anomaly is to open trader's minds to information that hides in plain sight that might offer then a long-term edge in the markets.
Part II will highlight a typically unfavorable time of month.