
Money Manager Activity Paints a Still Favorable Picture for Stocks

Key points:
- The NAAIM Exposure Index tracks professional money managers' market exposure
- These managers tend to be good at identifying a market trend with staying power
- NAAIM members' activity recently triggered a signal that has tended to be favorable for stocks
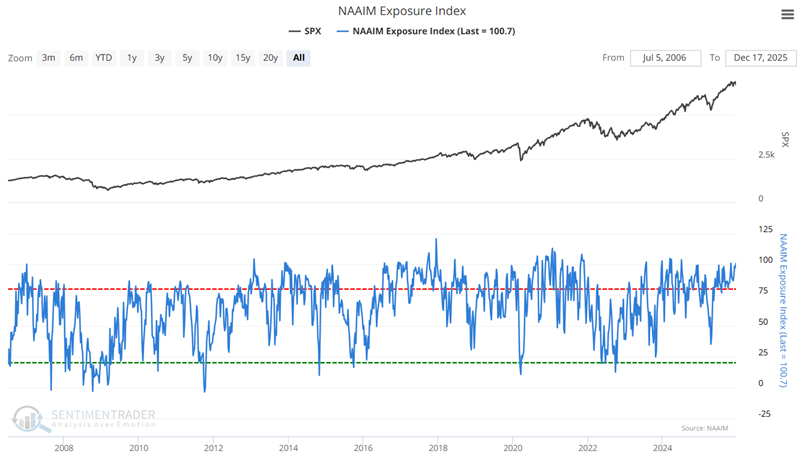
The NAAIM Exposure Index has reached a high level
In the world of investing, there are four factors to consider:
- How people think and feel about the market
- How they actually behave with their available investment funds
- Whether a person has some well-thought-out plan or process for investing
- Or if they are essentially making it up as they go along based on #1 above
For example, the AAII Bull (and AAII Bear) indicators, as well as our own Panic/Euphoria Model, essentially measure #1 and #4. These are pure sentiment gauges and tend to be right in the middle but wrong at the extremes. In other words, extreme readings in those indicators tend to serve as contrary indicators as they suggest that sentiment has gone too far in one direction.
The NAAIM Exposure Index is - in this author's opinion - a different animal. This indicator essentially combines #2 and #3 above and measures what people who manage money for a living actually do with the funds they control. While they are susceptible to the same fear and greed influences as everyone else, in a majority of cases, they employ a well-thought-out investment strategy and are fairly disciplined in implementing their plan.
One other thing to note is that the index tends to serve as a trend-following tool, i.e., when market conditions start to improve, NAAIM members tend to increase their exposure to the stock market and vice versa.
From the website of the National Association of Active Investment Managers:
NAAIM member firms, which are active money managers, are asked each week to provide a number that represents their overall equity exposure at the market closing on a specific day of the week, currently Wednesdays. Responses can vary widely as indicated below. Responses are tallied and averaged to provide the average long (or short) position of all NAAIM managers collectively.
Range of Responses:
- 200% Leveraged Short
- 100% Fully Short
- 0% Cash or Hedged to Market Neutral
- 100% Fully Invested
- 200% Leveraged Long
Data collection issues that may affect the statistical significance of this data include:
- Use of a single composite number for each adviser may not accurately represent the market view of a manager who has short-term and long-term strategies that are providing conflicting signals, or a manager who uses both contra-trend and trend following strategies for different portfolios.
- Investment Styles vary widely among managers participating in this survey. They may include managers who trade very frequently and can switch long and short positions daily. Other managers stay fully invested at all times and only change allocations among market segments or sectors. Still others trade around core positions, and only a portion of their portfolios changes, but that portion could potentially shift from long to short very quickly.
- Sample size: Although the number of participating managers, known as NAAIM Trend Setters, is steadily growing, the sample size is not large and therefore may be less reflective of actual market conditions.
The NAAIM Exposure Index as a trend-following tool
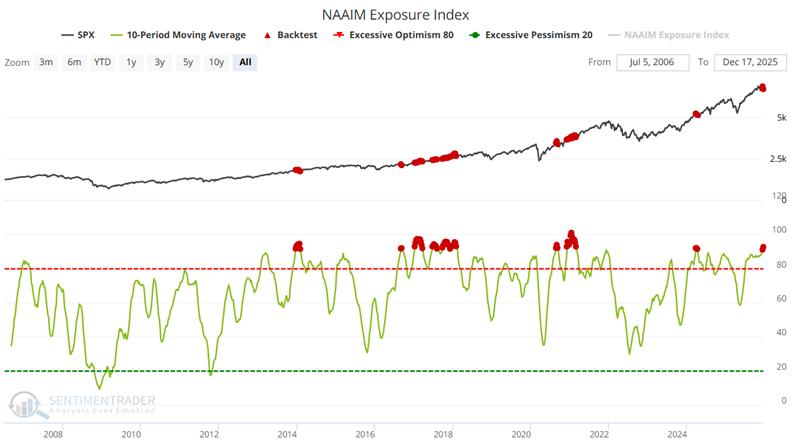
Remember that NAAIM members may at times employ leverage, which means that the index can exceed 100% on the upside and 0% on the downside. The chart below highlights all weeks when the index was above 99.9, indicating that NAAIM members were as bullish as they could be. The most recent signal occurred on December 17th.
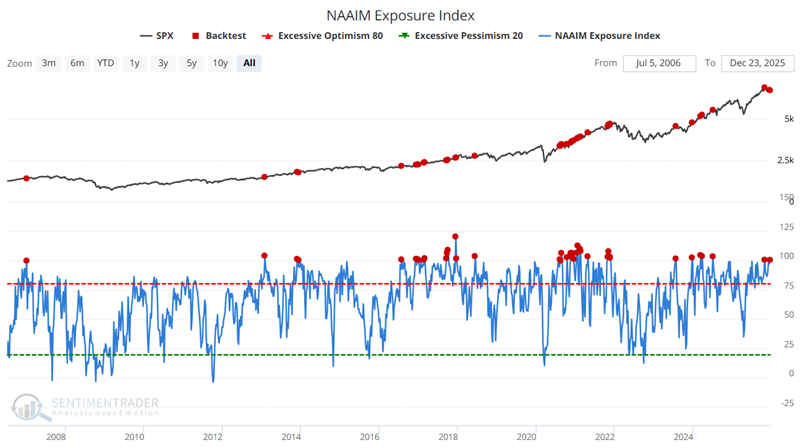
The table below summarizes the subsequent performance of the S&P 500.
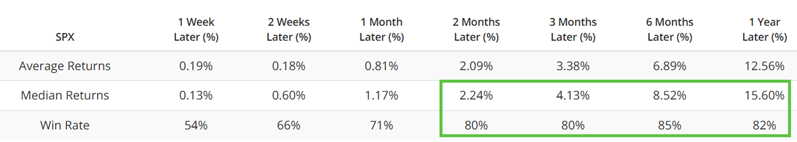
Time periods ranging from two months to one year show above-average Win Rates and Median Returns.
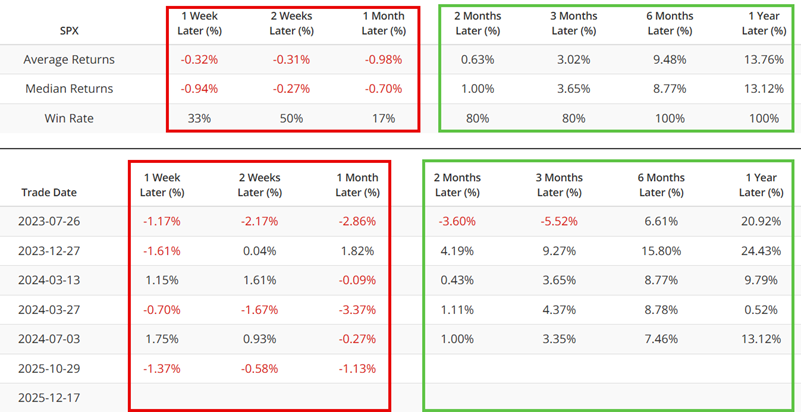
One concern worth noting is that short-term results have been poor during the last three years. The data for the last three years is presented in the chart below.
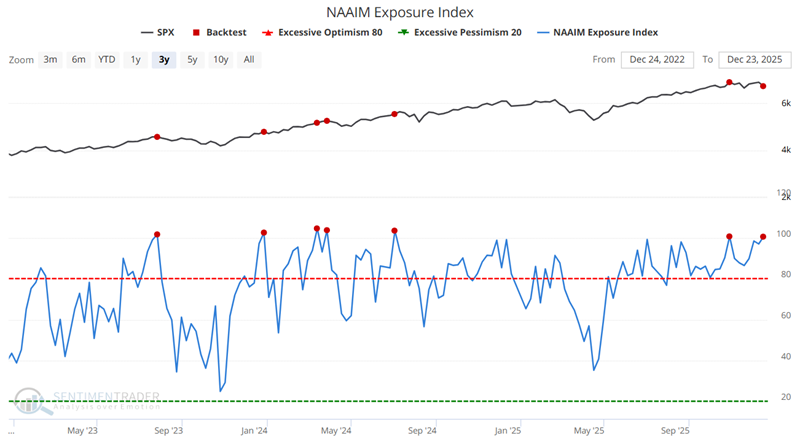
The table below summarizes the S&P 500's post-signal performance over the last three years. Over the past three years, the first month after a signal has yielded results well below average.
A look at smoothing the data
For the next test, the chart below shows all weeks when the 10-week moving average of the NAAIM Index was above 91%. The most recent signals occurred on December 10th and December 17th.
The table below summarizes the subsequent performance of the S&P 500.
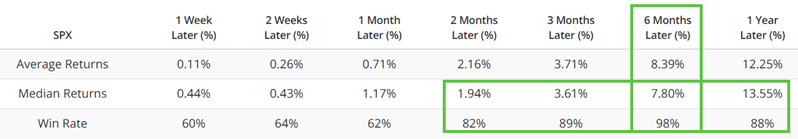
Note that the S&P 500 was higher six months later 98% of the time. This suggests good reliability as a trend-following signal. Let's examine what this looks like when applied as a trading strategy.
Building a strategic approach in Backtest Edge
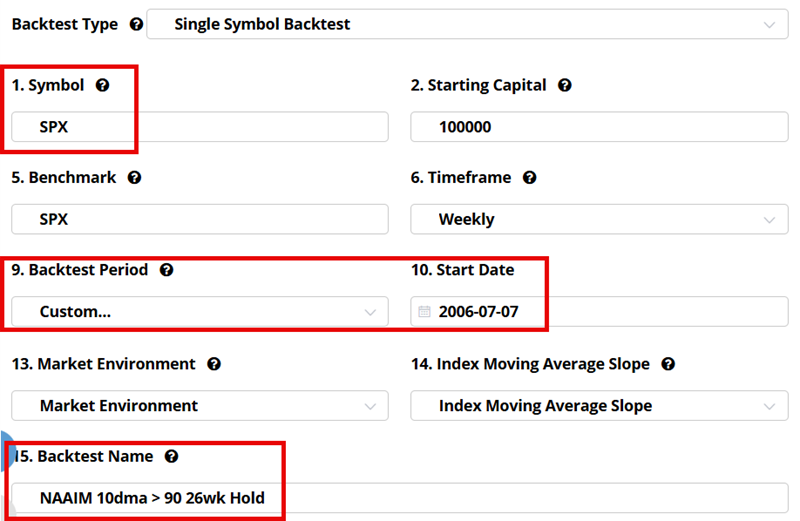
The test below can be found in Backtest Edge under Analyst Backtests. The following screens show the Setup steps to create a "Single Condition" test (which is already done for you under Analyst Backtests). The first screen names the strategy and sets a Start Date.
The screen below sets the entry criteria whereby the 10-period average for the NAAIM Exposure Index crosses above 91.
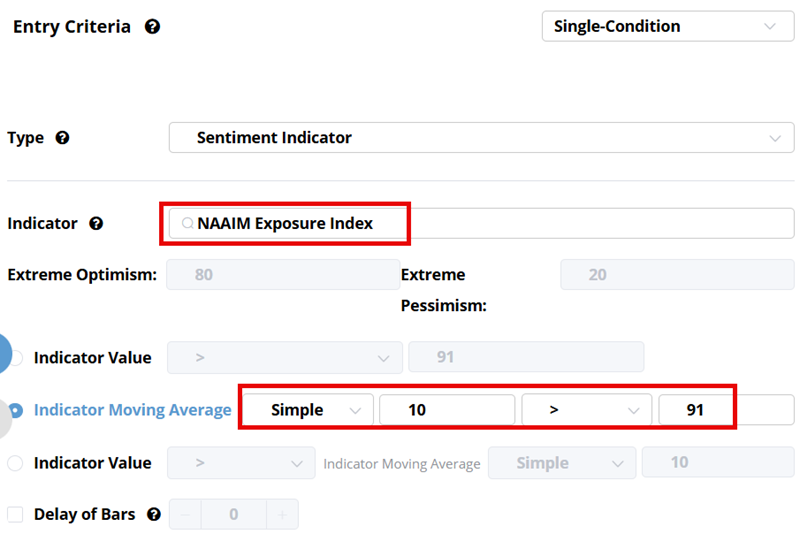
We set the exit criteria for 26 weeks. Once everything is set up, we can click "Run Test" to generate results.
Analyzing the Strategy Test Results
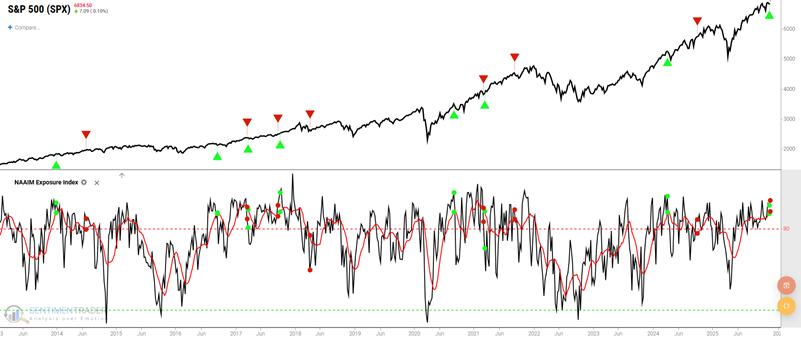
The chart below displays all entry and exit signals for this test. Note that most of the green arrows occur in the context of an established uptrend.
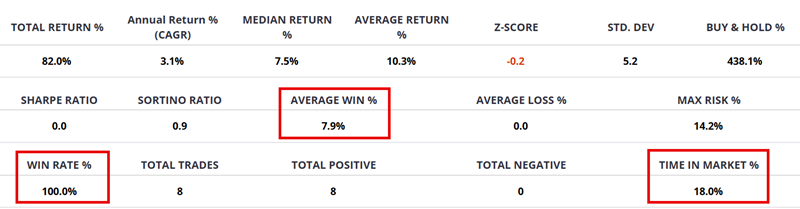
The table below summarizes the results of the entry and exit signals. The strategy is in the market only 18% of the time, with a six-month Win Rate to date of 100%.
The chart below displays the hypothetical equity curve (i.e., the Cumulative % +(-)) achieved by holding the S&P 500 for 126 trading days after each new signal. The key thing to note is the "lower left to upper right" nature of the equity curve.
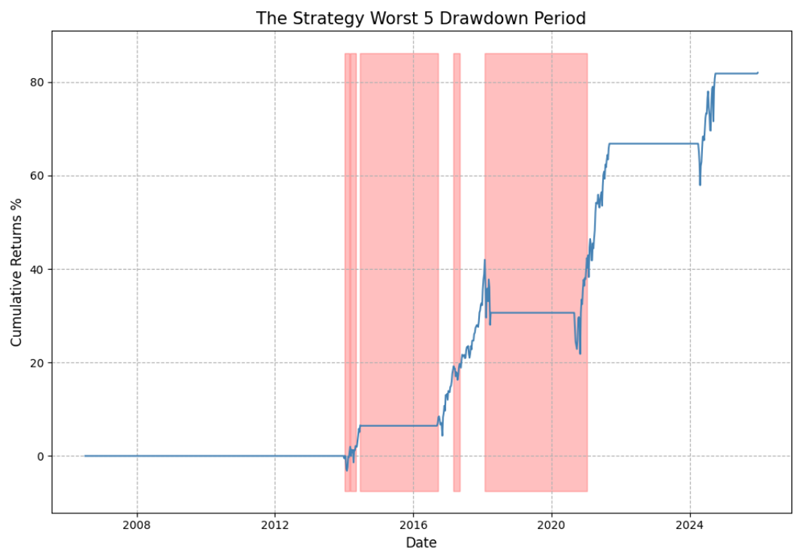
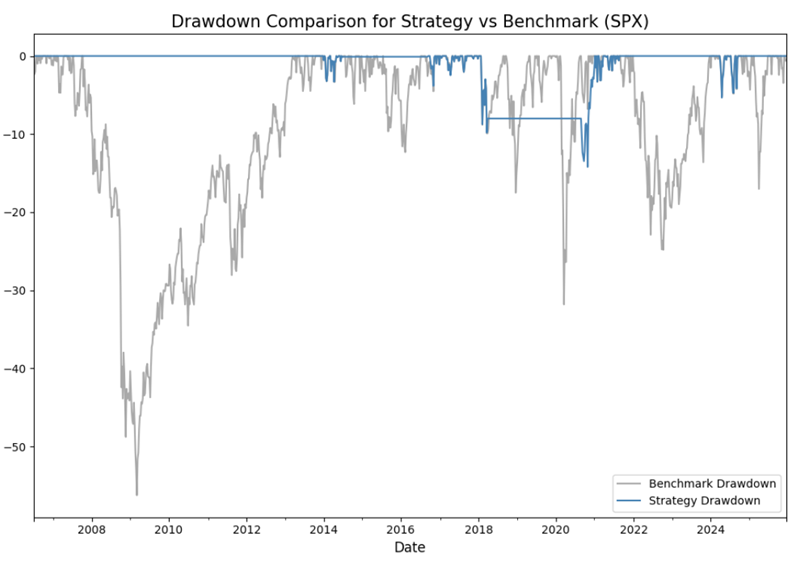
The chart below displays the hypothetical % drawdowns that would have been incurred while holding a long position in the S&P 500 between all entry and exit signals (blue line) versus the hypothetical % drawdown incurred using a buy-and-hold approach.
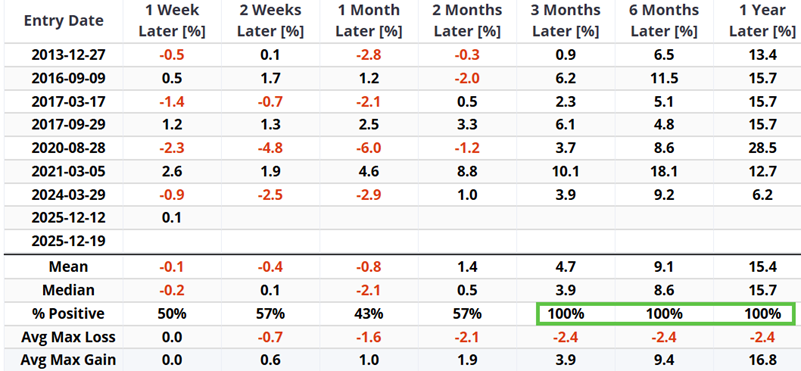
The table below displays returns by timeframe following each entry signal generated using the rules above.
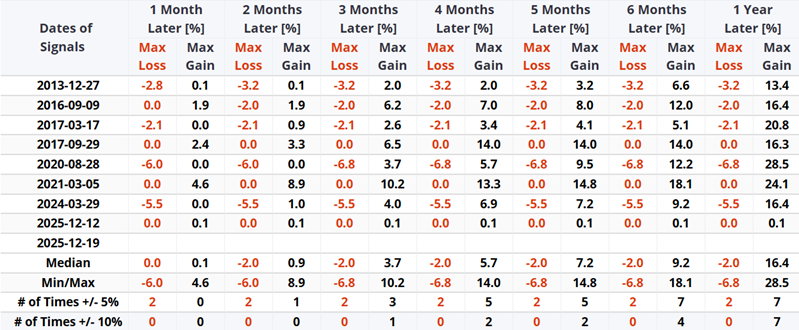
The table below shows the maximum percentage gain and maximum percentage loss following each signal.
What the research tells us…
The strategy highlighted here is not presented as a "world-beater, you can't lose trading stocks" idea. It does, however, represent a potentially valuable input for swing traders to consider when deciding whether to allocate capital to the stock market. NAAIM members are not "precision market timers." However, when their actions are taken in sum, they have established a decent track record of identifying sustainable market advances (although short-term results over the last three years have been subpar), which may have some staying power over the next three to twelve months. If history proves a useful guide, the recent signal from the NAAIM Exposure Index suggests strong potential for the stock market to move higher during the first half of 2026.