
Monetary policy and inflation fears have peaked

Key points:
- Monetary policy and inflation can have a significant impact on the economy and stock prices
- Extremes in fearful sentiment typically presage sustained market rallies
- Two little-known data sets that measure sentiment regarding monetary policy and inflation have flashed noteworthy signals
What investors think about monetary policy is what matters to stocks
Most investors don't spend much time thinking about monetary policy if they can help it. But when they do, it is more likely to happen when there is a reason for concern regarding the economy.
Investors may be able to use this tendency to their advantage.
In the U.S., monetary policy revolves around the actions taken by the Fed to control the money supply and influence the economy. Through these policies, the central bank aims to achieve specific macroeconomic goals, such as maximum employment and price stability.
Whether monetary policy successfully achieves these goals is secondary. What really matters to the stock market is what the masses think about monetary policy.
The Economic Policy Uncertainty Index: Categorical Index: Monetary Policy is a little-known data set based on news data. The EPU Categorical Data sets are derived using results from the Access World News database of over 2,000 US newspapers.
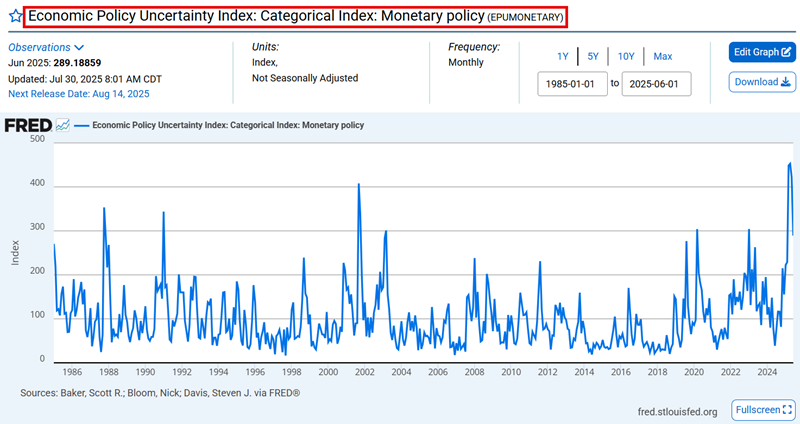
The reading is usually released mid-month, but we interpret data only at the end of the month for testing purposes. So, the June reading would be released in mid-July, and we would evaluate that reading on the last trading day of July.
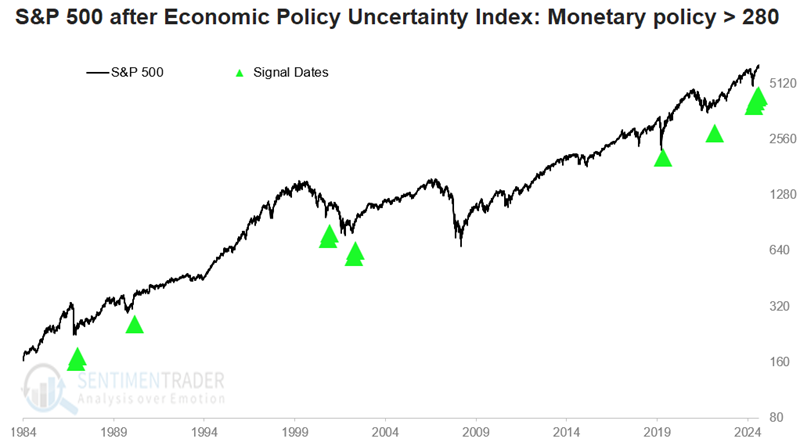
This index measures the degree of uncertainty among investors regarding monetary policy. The higher the index reading, the greater the uncertainty. The more sentiment moves in one direction, the more likely it is to be wrong. Let's test that theory by looking at the extremes in the chart above.
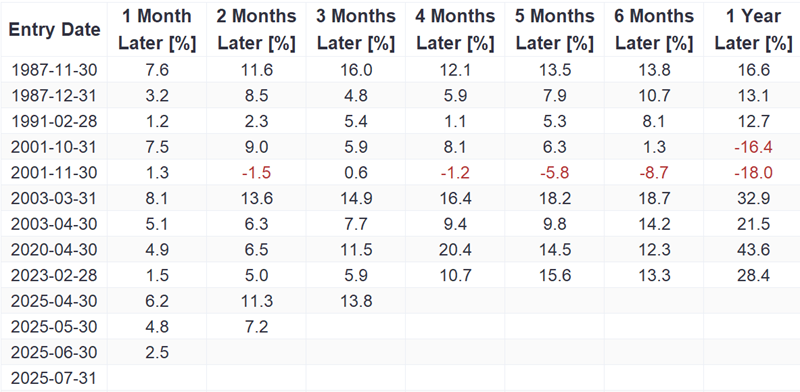
Every month in which the index closed above 280 is marked below with a green arrow and includes overlapping signals. The most recent signals occurred at the end of June and July 2025. One- and three-month returns were positive in each case.
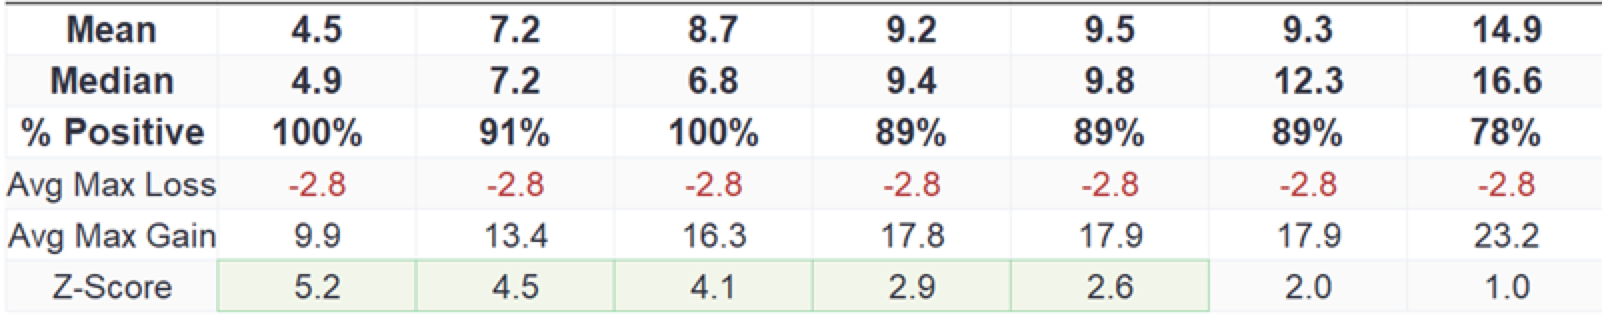
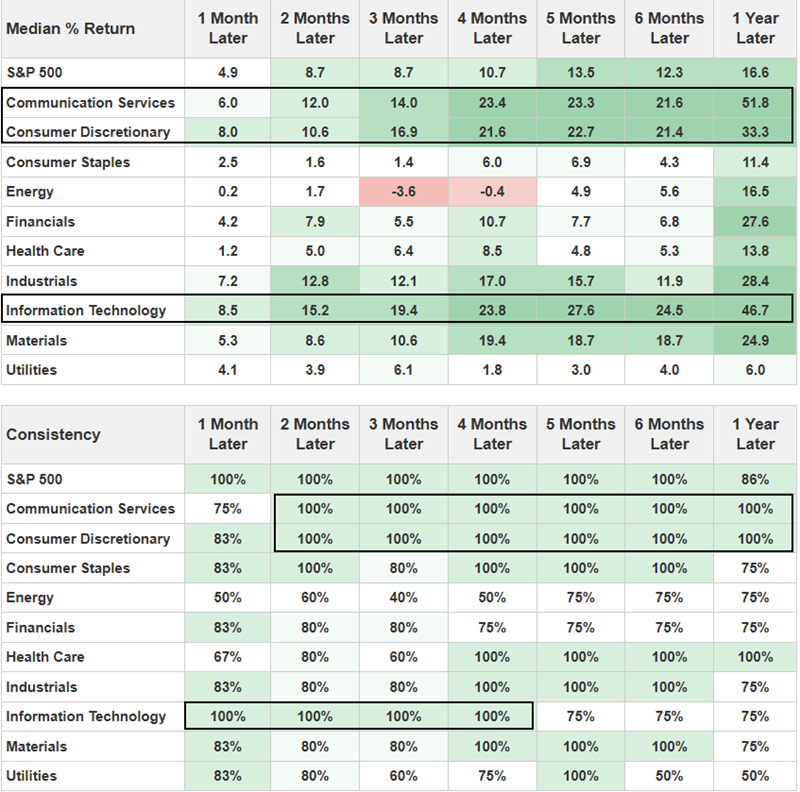
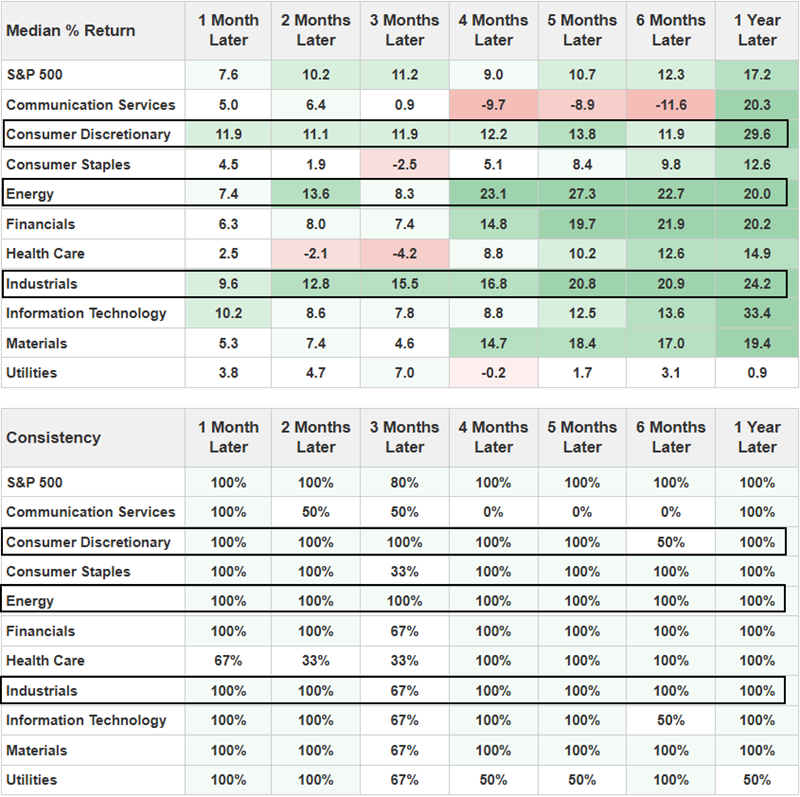
If we turn our attention away from the S&P 500 index to the various sectors, we find the potential for larger gains in technology, consumer discretionary, and communication services. Note that technology has shown a 100% win rate four months after a signal and a median return of almost 24%.
Inflationary fears also remain high…and that's a good thing
The market hates uncertainty, and few things create more uncertainty than rising inflation. Interestingly, while soaring inflation is negative for stocks, soaring fear regarding inflation is bullish.
The Equity Market Volatility Tracker: Macroeconomic News and Outlook: Inflation index is another little-known data set based on news data that measures inflation-related fear.
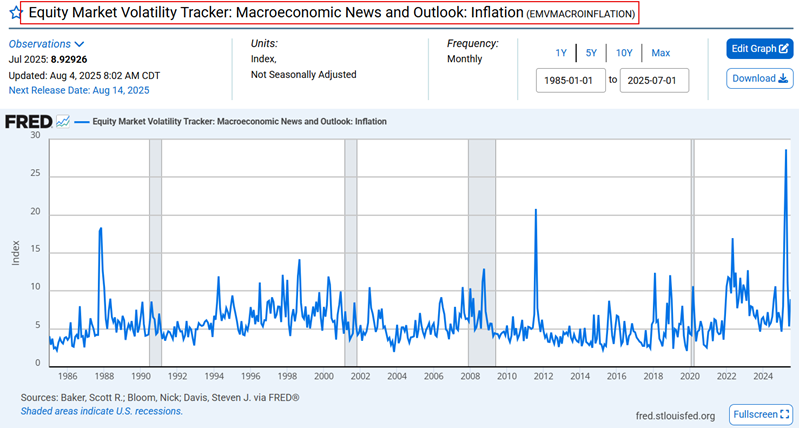
This index is reported mid-month, with a one-month lag, and is evaluated at the end of the month reported. It measures investors' concern about inflation. The higher the index reading, the greater the concern. Once again, when concern/fear peaks, the stock market has already discounted these fears.
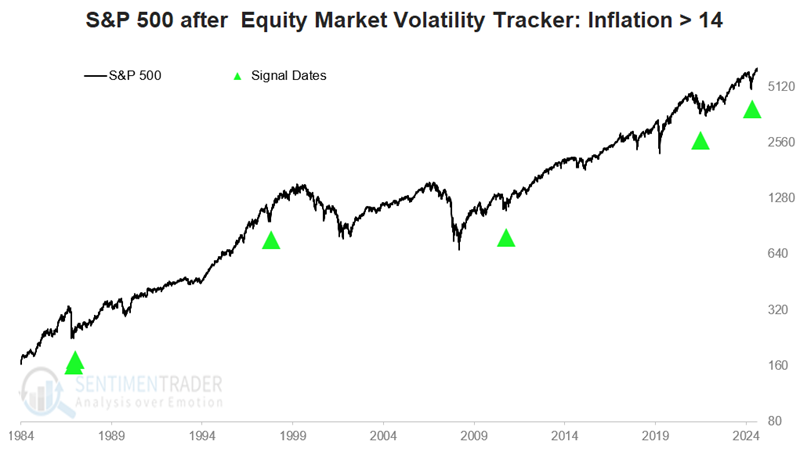
Every month in which this index closed above 14 is marked below with a green arrow and includes overlapping signals. The most recent signals occurred at the end of April and May 2025.
The tables below reveal high win rates and above-average median returns across the board.
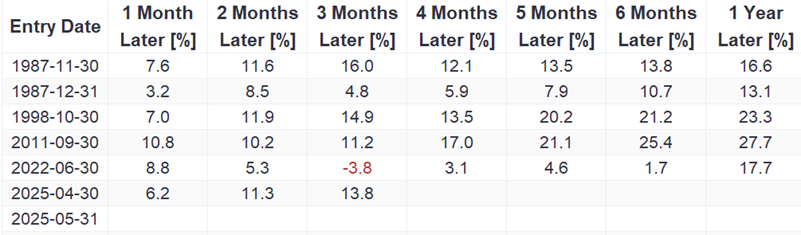
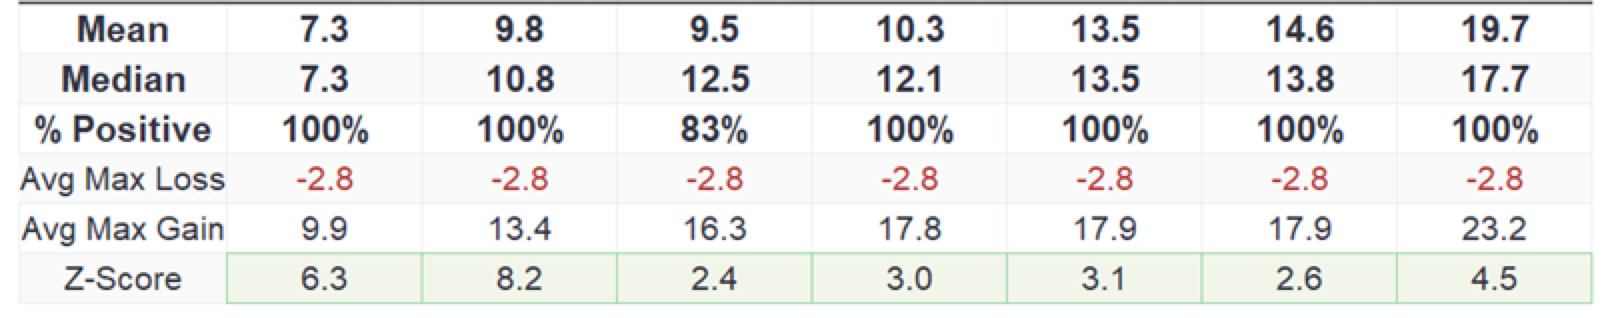
While the sample size is small, energy, consumer discretionary, and industrials have been terrific performers following previous signals.
What the research tells us...
The value of studying sentiment is that human nature never changes. When bad economic news unfolds, investors become ever more fearful as the situation worsens.
But the stock market typically looks six to nine months down the road. So, when investor fear peaks, the market has already discounted the bad news and may be poised to rebound. Monetary policy and inflation are huge factors that affect the economy and the market. The two data series detailed here don't reach extremes often. But when they do, they typically indicate the type of fear that presages a sustained advance in stock prices and should be a good sign for the months ahead.