Monday Midday Color - Gaps Again, Sector Divvies, Flight To Safety

Here's what's piquing my interest on yet another weak day so far.
More Panic
Yet another gap down open this morning, as the weeks-long pattern of pre-market panic continues. We've already looked at this a few times, but there's perhaps a better way to consider this.
The gaps we've been seeing at the open are among the worst since the financial crisis (and before), but it't not really fair to compare the readings now versus 2008 when volatility was exponentially higher. So if we look at the pre-market opens over the past couple of weeks relative to what investors have been used to over the past year, then we can get a better feel for just how much nervousness there is out there right now.
And it's a lot.
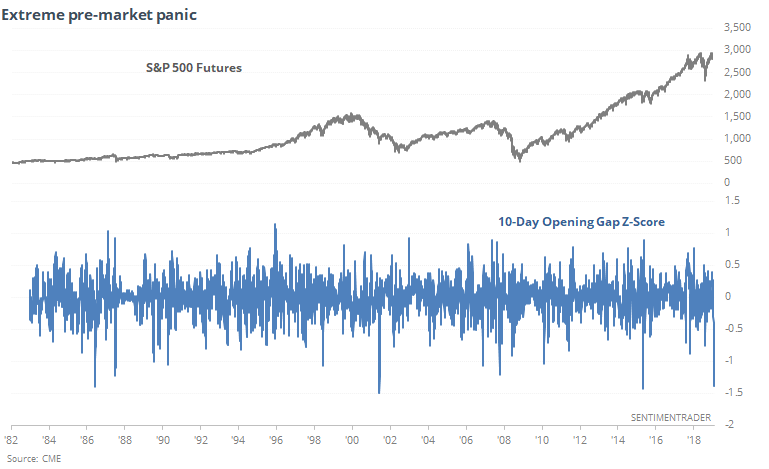
The only times that were about comparable to what we're seeing now were August 2015, September 2001, and September 1986. Extreme, indeed.
Energy - Utilities Spread
The always-observant Helene Meisler notes that the dividend yield on XLE has climbed above that on XLU. Going back further than those ETFs allow, we can see that the yield on the S&P 500 energy sector is, indeed, historically high again vs that on utilities.
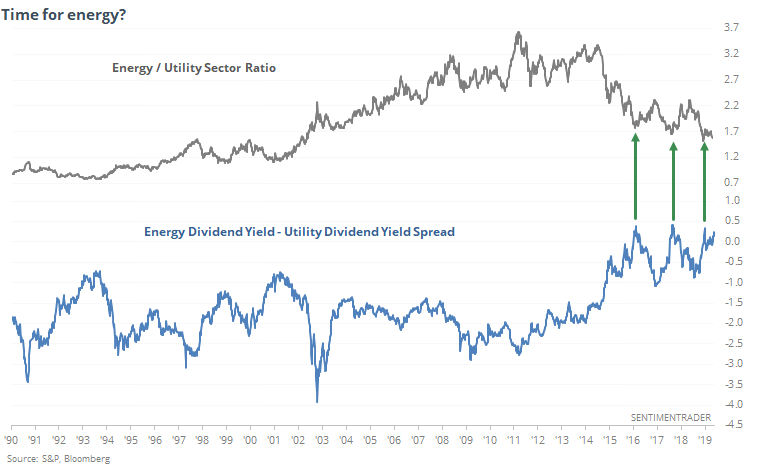
Prior to the last five years, energy hadn't yielded more than a dollar more than utilities, and when it did, the ratio of energy to utilities turned higher. Over the past few years, the spread has gotten wider, and when it reached 0.5, the ratio also bottomed.
That's about where it is now.
Fleeing To Safety
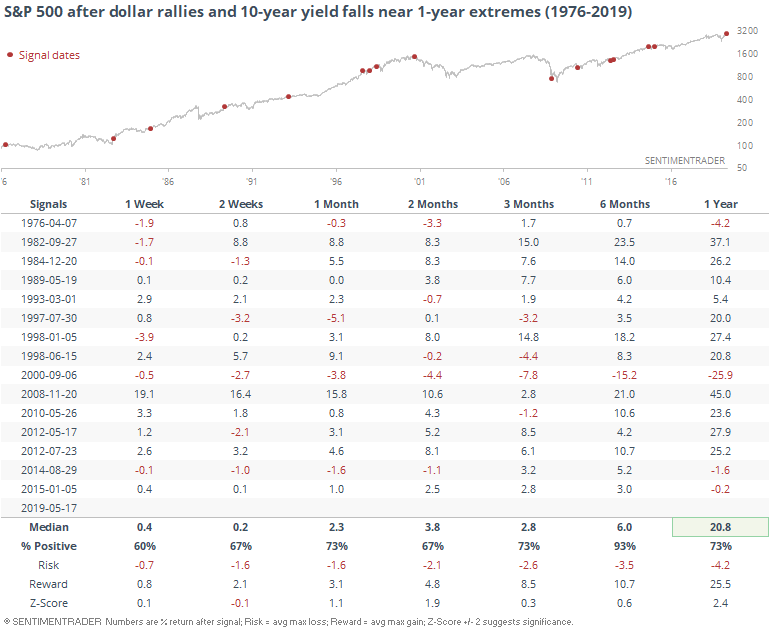
According to a report from the Wall Street Journal, one sign of extreme risk-off behavior last week was shown by investors piling into Treasuries, which helped to push up the U.S. dollar.
The dollar’s haven appeal tends to kick in during times of extreme market stress, as investors liquidate riskier bets and pile into Treasurys.
The two may not be that closely correlated, but there's no arguing the fact that yields have plunged while the dollar has soared in recent sessions, both near their year-long respective extremes.
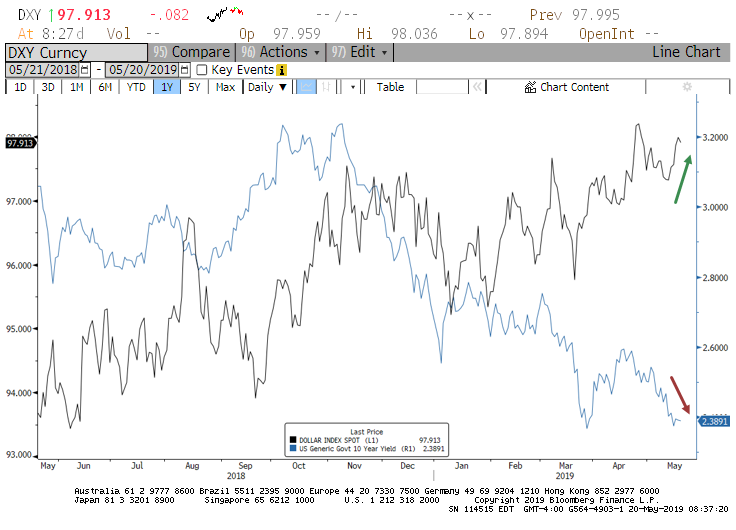
That has usually coincided with periods of heightened concern and decent returns in stocks going forward, with the most jarring exception in 2000.
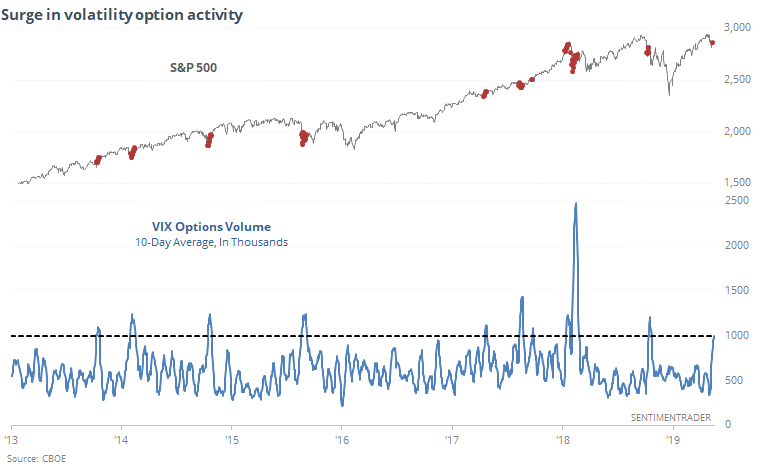
Scrambling
The past 10 days have seen several signs of near-panic conditions, most prominent being the persistent gaps down in the morning, which we saw yet again.
That has led traders to speculate on the VIX "fear gauge", driving options volume to the highest level since last fall.
Breadth Review
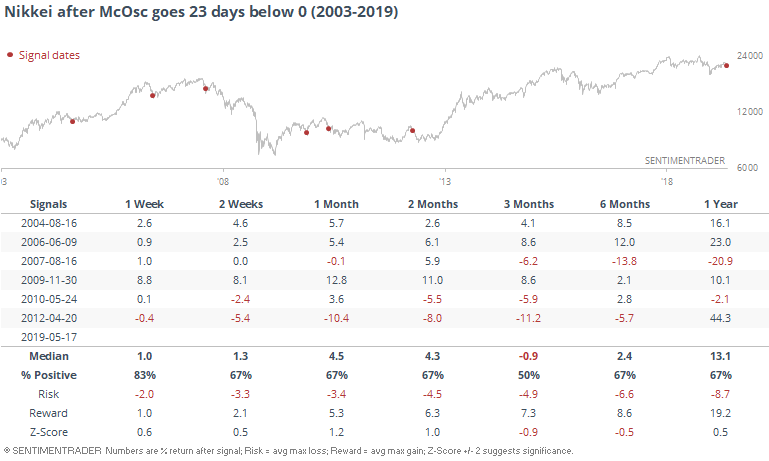
There weren't any new breadth extremes of note lately, but one market that sticks out is the Nikkei. Those stocks haven't been able to show any momentum at all for more than a month. The McClellan Oscillator has now been below the zero line for 23 straight sessions.
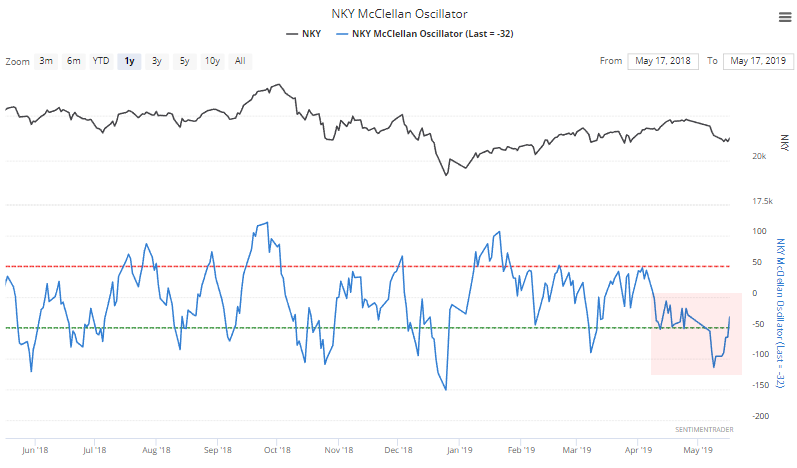
That's a very long time for that market. And mostly a good sign for the shorter-term.
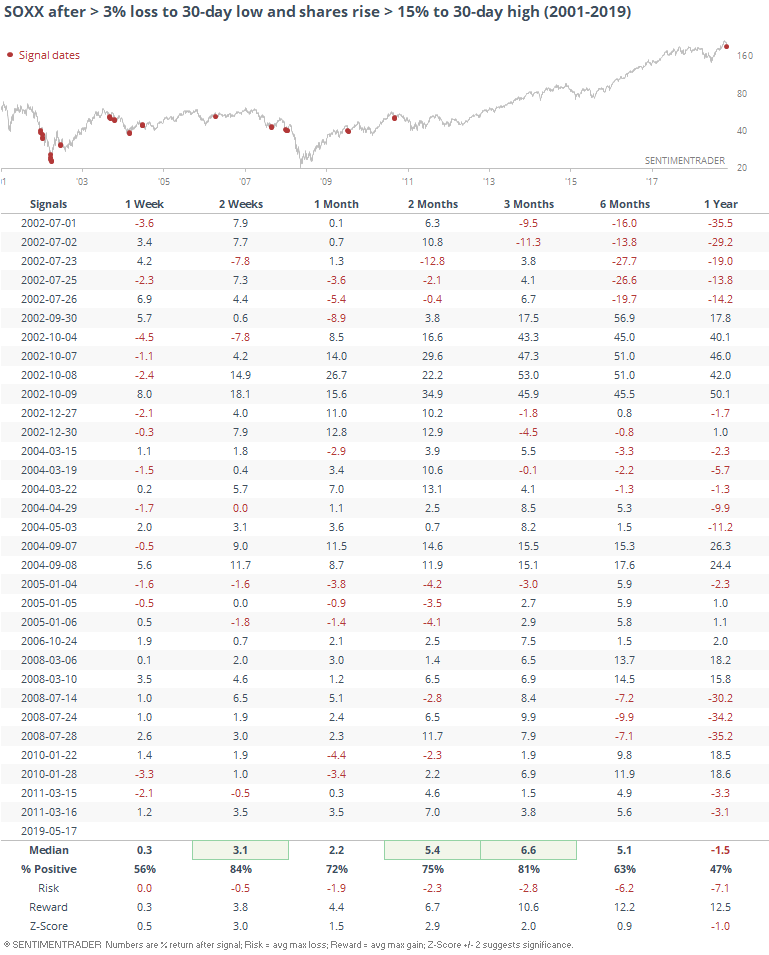
Flows
Due in large part to trade worries (or so the narrative goes), semiconductor stocks have been getting sold hard. Curiously, money is flowing into some of those ETFs. Shares outstanding in funds like SOXX have skyrocketed while the shares themselves have been selling off.
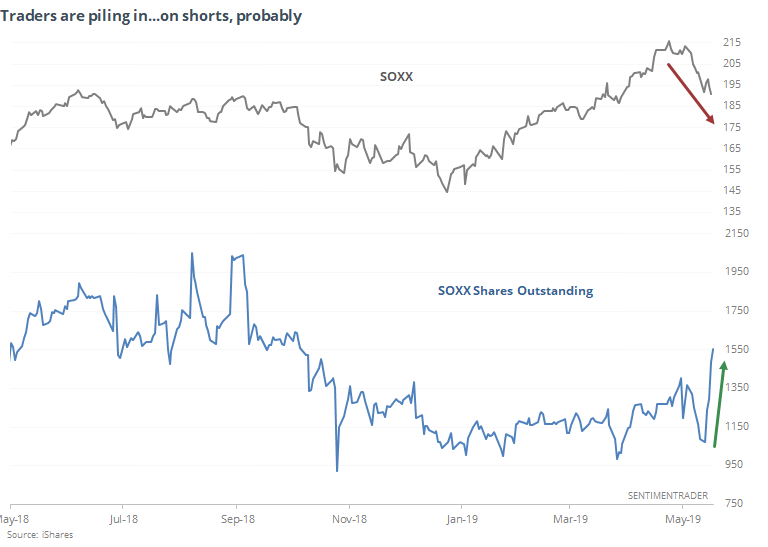
That suggests that traders are buying the dip...but it's not that easy, and probably totally wrong. Most likely, there is a heavy demand for short selling, and shares need to be created to cover those shorts. So what we're likely seeing is heavy shorting, not buying.
Historically, future returns would tend to agree with that thought.