Products
SentimenTrader Trading Tools
‍
Backtest Engine
My Trading Toolkit
Correlation Analysis
Seasonality
Market Prediction
Indicators & Data API
‍
Proprietary Indicators & Charts
Market Data API
Strategies & Scanner
‍
50+ Trading Strategies
Smart Stock Scanner
Smart Option Scanner
Research Reports
‍
Research Solutions
Reports Library
Free Resources
Simple Backtest Calculator
Simple Seasonality Calculator
The Kelly Criterion Calculator
Sentiment Geo Map
Public Research Reports
Education
Sentiment Indicators
Technical Indicators
Pricing
Company
About
In the News
Testimonials
Client Success Stories
Contact
Log inLoginSign up
< BACK TO ALL REPORTS

Monday Midday Color

Jason Goepfert
2019-04-15
null

Here's what's piquing my interest so far on tax day.
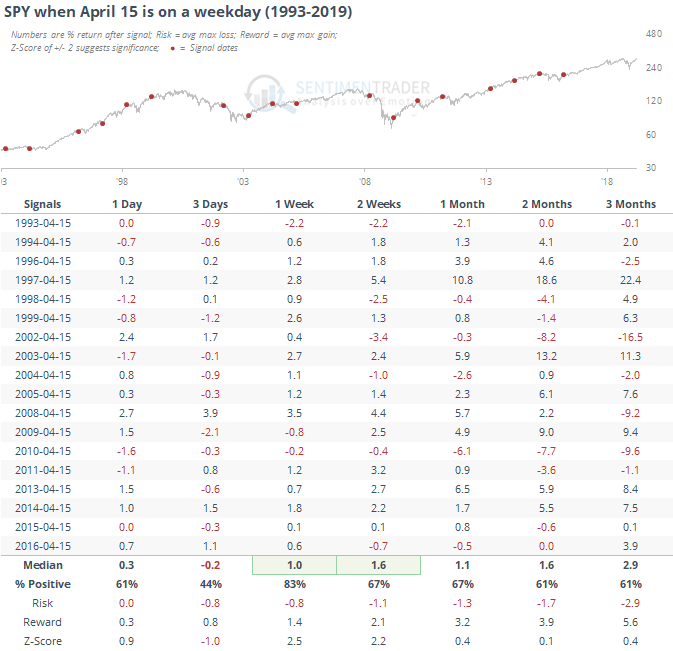
April 15

Just because.

Monday Midday Color

Breadth Review

There was another surge in French stocks hitting multi-month highs to end last week, at nearly 50% of CAC components.

Monday Midday Color

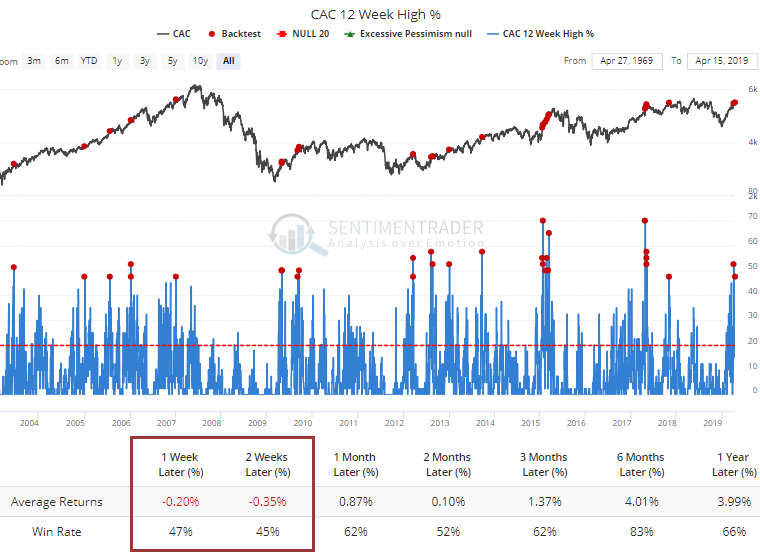
That has helped to push its long-term breadth momentum to an extreme.

Monday Midday Color

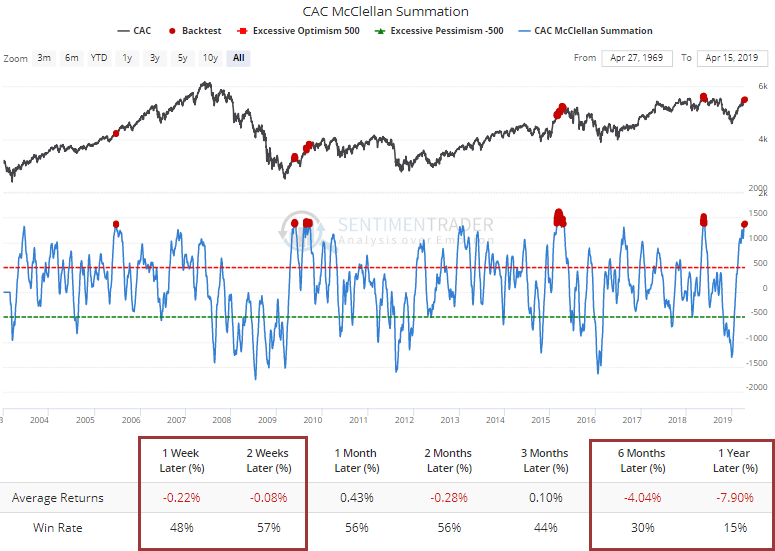
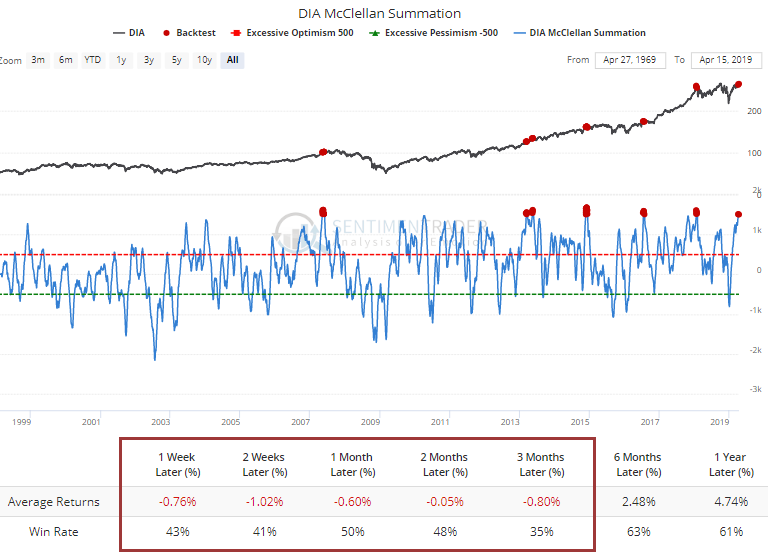
In the U.S., the McClellan Summation for the Dow just hit 1500. It's been tough to maintain that kind of surge.

Monday Midday Color

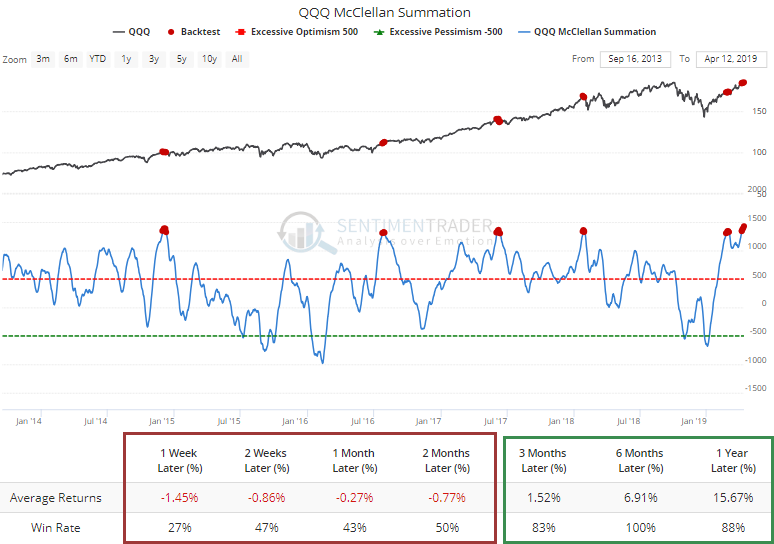
Same with the Nasdaq 100 (it never got this high prior to 2015).

Monday Midday Color

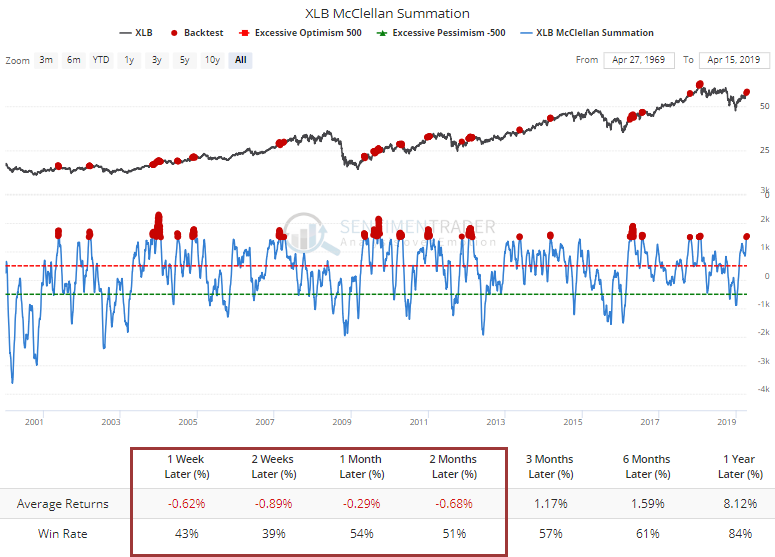
Among U.S. sectors, that's also the case for basic materials.

Monday Midday Color

China Rising

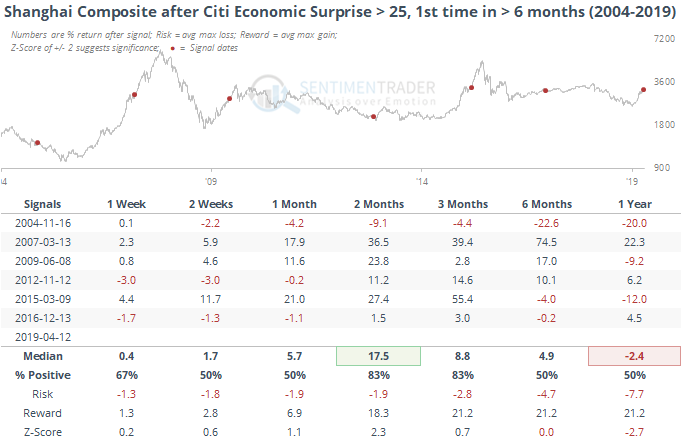
According to the WSJ, economic surprises in China are becoming increasingly more positive. The Citi Economic Surprise Index is now above +25 for the first time in more than 220 days.

Monday Midday Color

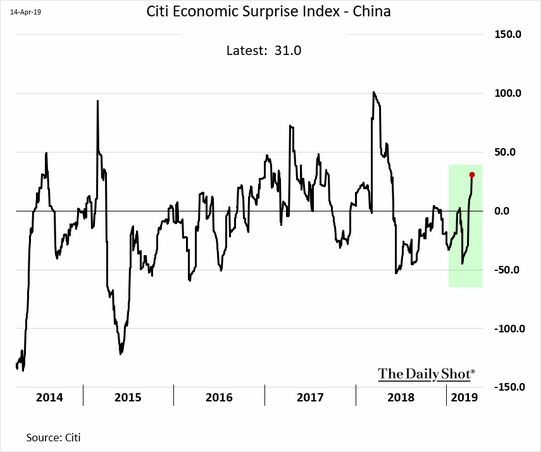
That's been a decent sign over the next couple of months.

Monday Midday Color

Seemingly less positive, the Shanghai Composite rallied 2% intraday to start the week, then reversed to close down on the day. During its intraday run, it had surpassed its previous 52-week high close.

Monday Midday Color

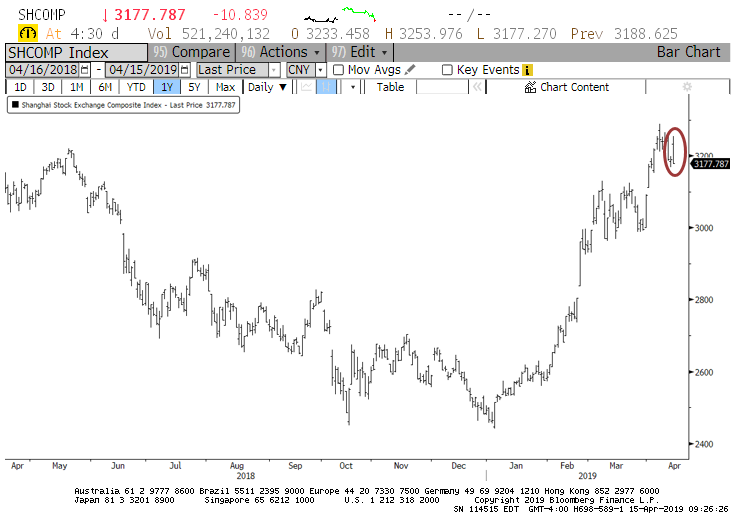
This seems like a negative technical reversal, but historically that hasn't meant much for the index.

Monday Midday Color

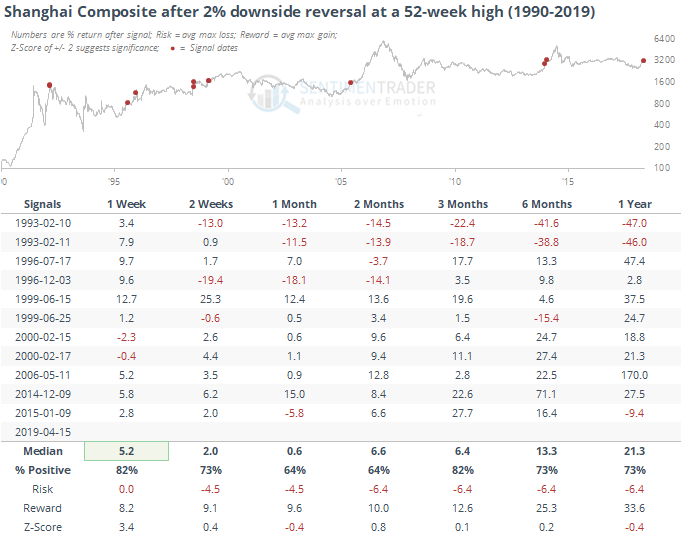
After 1993, these "negative technical reversals" preceded gains over the next three months every time.
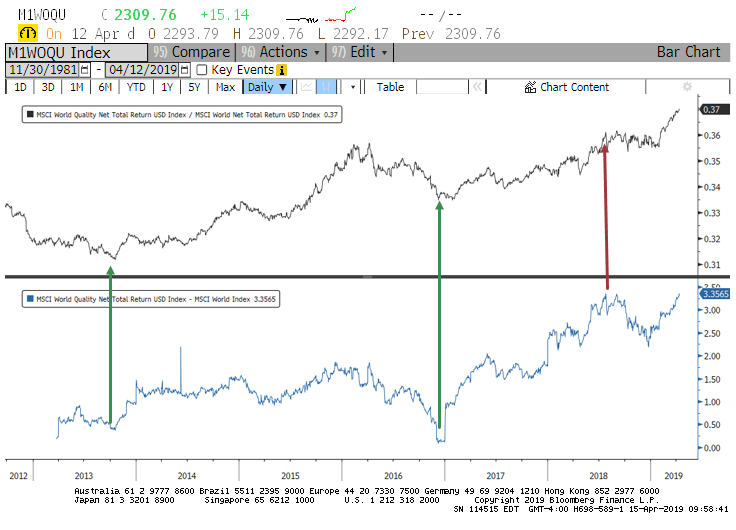
Quality Counts

Bloomberg notes that "quality" stocks have had such a run that they may have gotten ahead of themselves. The forward P/E ratio for quality stocks around the world has ran ahead of the forward P/E for the broader market.

Monday Midday Color

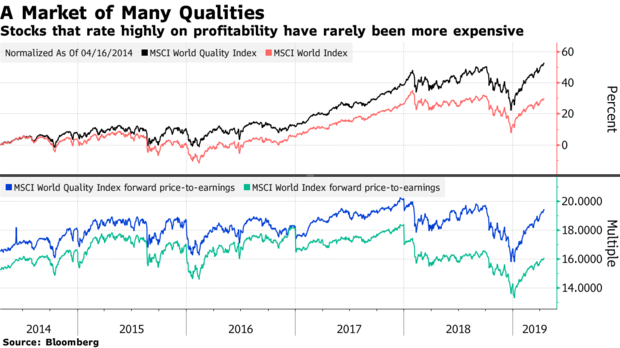
If we look at the spread between the forward P/E on quality stocks to that of the broader (world) market, we can see that it's the highest since at least 2013. The last time it got this high, quality went into a half-year funk relative to other stocks.

Monday Midday Color

PRODUCTS
SentimenTrader
Trading Tools
Indicators & Data API
‍
Strategies & Scanner
‍
Research Reports
FREE
RESOUrCES
Simple Backtest
Calculator
Simple Seasonality
Calculator
The Kelly Criterion
Calculator
Sentiment Geo Map
‍
Public Research Reports
‍
Education
Sentiment Indicators
‍
Technical Indicators
‍
Pricing
Bundle pricing
‍
FAQ
‍
Announcements
‍
COMPANY
‍
About
‍
In the News
‍
Testimonials
‍
Client Success Stories
CONTACT
‍
General Inquiries
‍
Media Inquiries
‍
Financial Professionals Inquiries
‍
© 2026 Sundial Capital Research Inc. All rights reserved.
Setsail Marketing
TermsPrivacyAffiliate Program
Risk Disclosure: The information and tools provided are for research and analytical purposes only and are not intended as investment advice. Market analysis involves uncertainty, and outcomes may differ from expectations. Users should conduct their own due diligence and consider their individual circumstances before making any financial decisions. Past performance is not necessarily indicative of future results.

Hypothetical Performance Disclosure: Hypothetical performance results have many inherent limitations, some of which are described below. No representation is being made that any account will or is likely to achieve profits or losses similar to those shown; in fact, there are frequently sharp differences between hypothetical performance results and the actual results subsequently achieved by any particular trading program. One of the limitations of hypothetical performance results is that they are generally prepared with the benefit of hindsight. In addition, hypothetical trading does not involve financial risk, and no hypothetical trading record can completely account for the impact of financial risk of actual trading. for example, the ability to withstand losses or to adhere to a particular trading program in spite of trading losses are material points which can also adversely affect actual trading results. There are numerous other factors related to the markets in general or to the implementation of any specific trading program which cannot be fully accounted for in the preparation of hypothetical performance results and all which can adversely affect trading results.

Testimonial Disclosure: Testimonials appearing on this website may not be representative of other clients or customers and is not a guarantee of future performance or success.