
Monday Midday Color

Here's what's piquing my interest so far today.
Gap And Go?
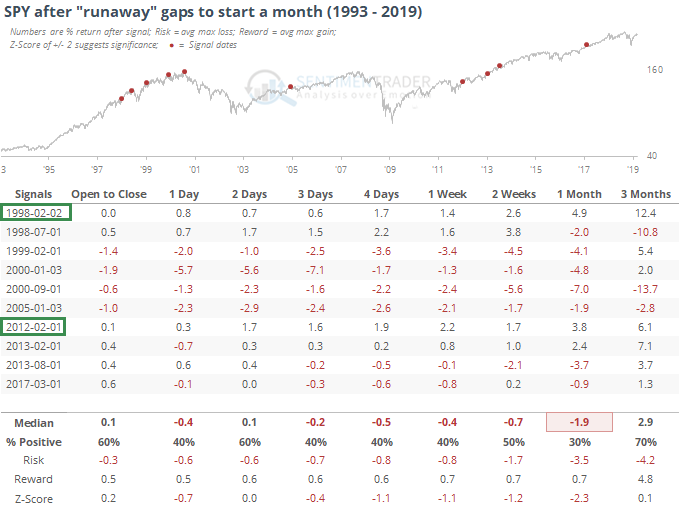
The S&P is trying to put in a runaway gap to start the month. It has mostly struggled, with the only true successes being in February '98 and '12. The others settled back as the months progressed.
Good Trend
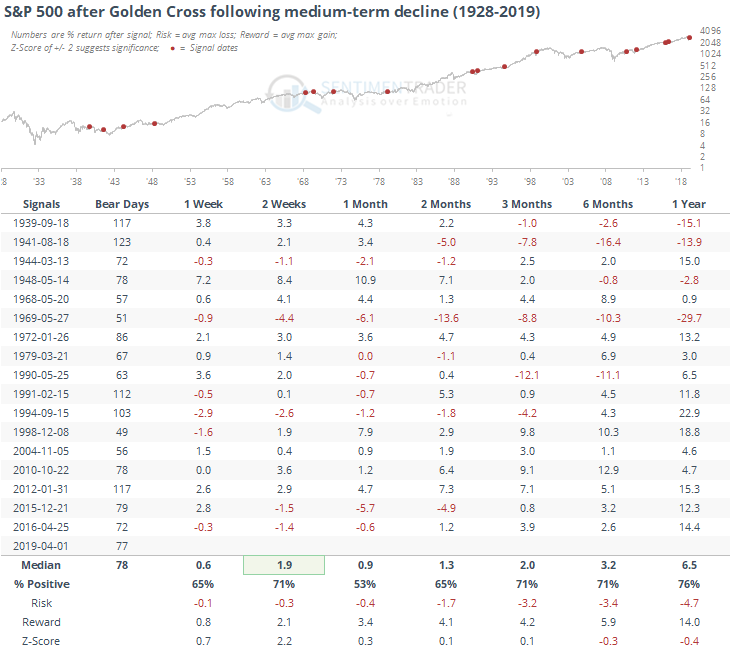
Just because it's going to be noted across the 'net and not necessarily because it means all that much, the S&P 500 will almost certainly enjoy a Golden Cross today. It's 50-day average will cross above its 200-day average. We might as well get this out of the way.
Using some context, this is the first positive cross in 77 trading days. If we look at other times they crossed after a medium-term decline, then we get the following returns. Since '72 it has been especially bullish with only two signal that led to anything more than nominal declines (in May 1990 and December 2015).
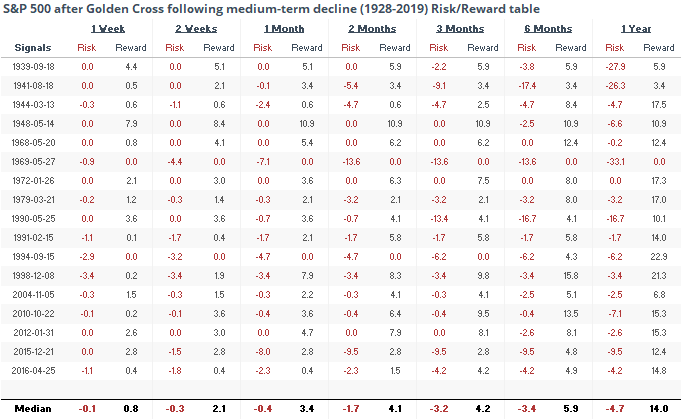
The Risk/Reward table shows few large declines even up to six months later. Five of them suffered a loss of more than 5% at the worst point while eleven gained more than 5% at the best point.
Big Rally In Flat Market
Michael Santoli, one of the sharpest eyes in mainstream financial media, noted that stocks have rallied hard during a longer-term flat market.
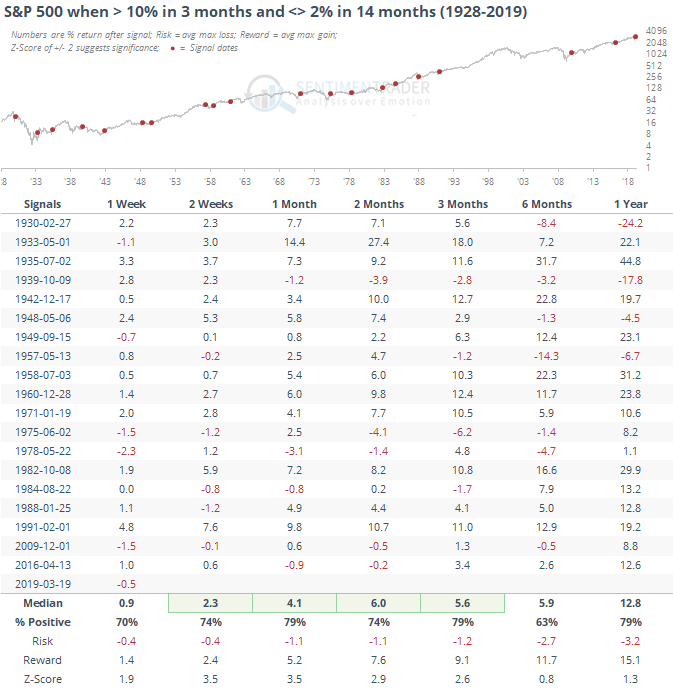
Market still flat the last 14 months
This dissonance also applies to the various ways the stock market’s trend can be characterized. The market is up more than 20 percent in a bit more than three months — but still negative since late September as the S&P has not decisively cleared a stubborn resistance areas on its chart between 2800 and 2850. And it has gone nowhere on a net basis for fourteen months.
This hasn't happened very often. One led to some quick upside follow-through then outright collapse, the other two led to excellent gains.
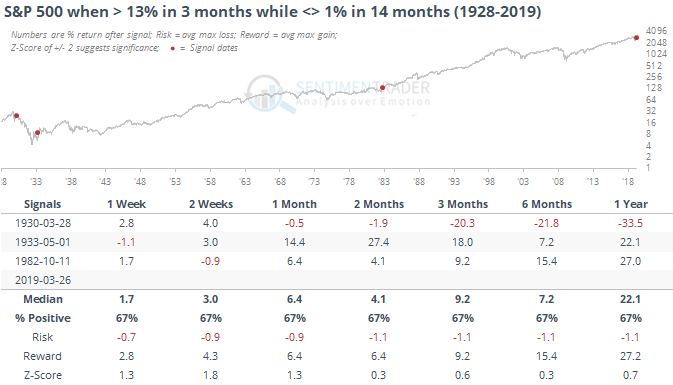
If we relax the parameters to get a larger sample, then we see more of a positive bias with an excellent risk/reward skew over the next 1-3 months.
Noncommittal
The weekly data showed that small options traders picked up their hedging activity a bit last week. It got fairly low in recent weeks but is now the highest since late January.
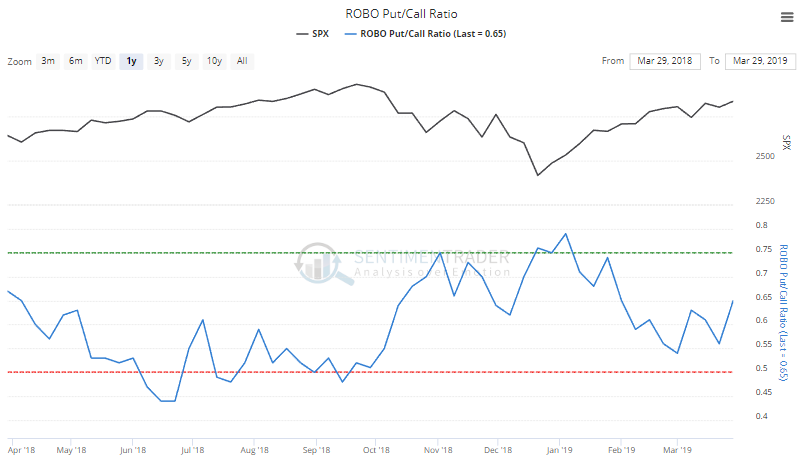
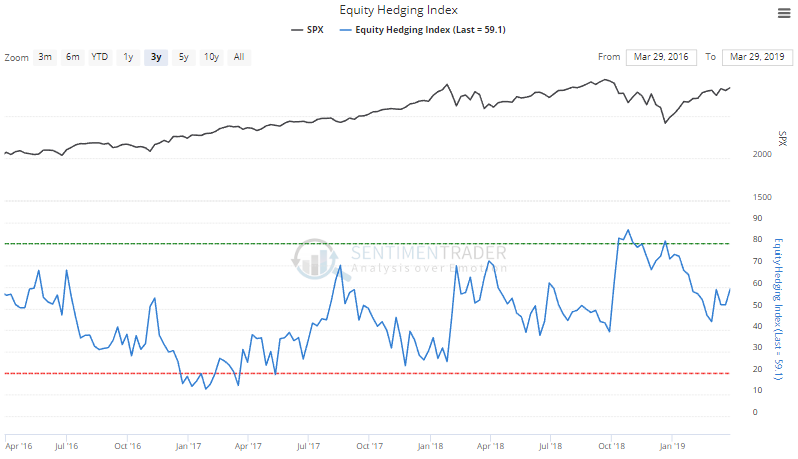
That's an input to the Equity Hedging Index, which also rose this past week.
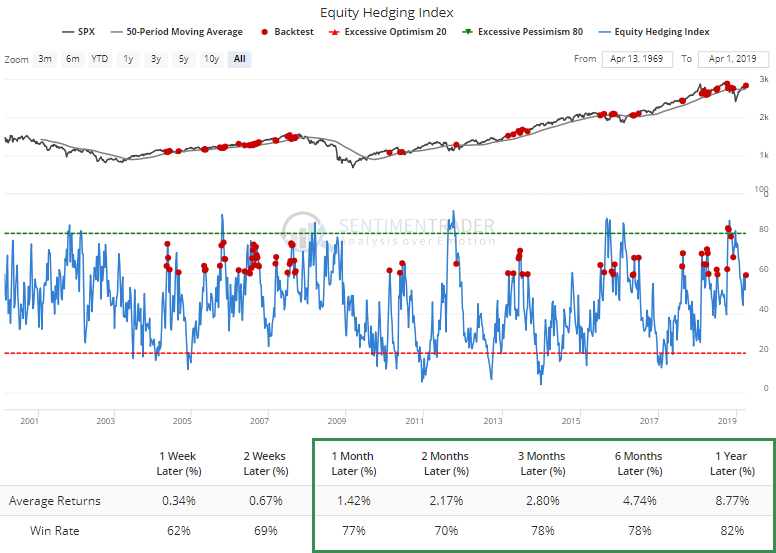
A reading this high when the S&P is above its 50-week moving average has been mostly positive according to the Backtest Engine.
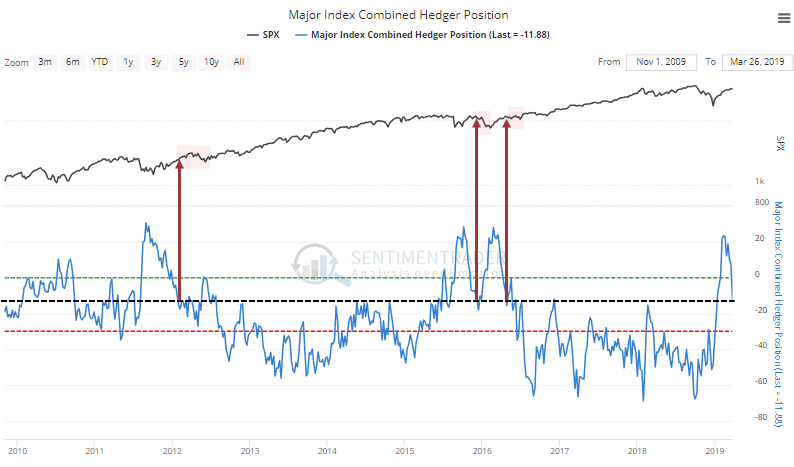
The "smart money" hedgers have started to roll back their aggressive bets on stocks, finally. The three other times they went long more than $20 billion worth of futures and then pulled back to this degree, the S&P kept rallying hard once in the short-term (2012) then erased those gains. The other two times, it plateaued quickly. This is a minor concern.
Defensive
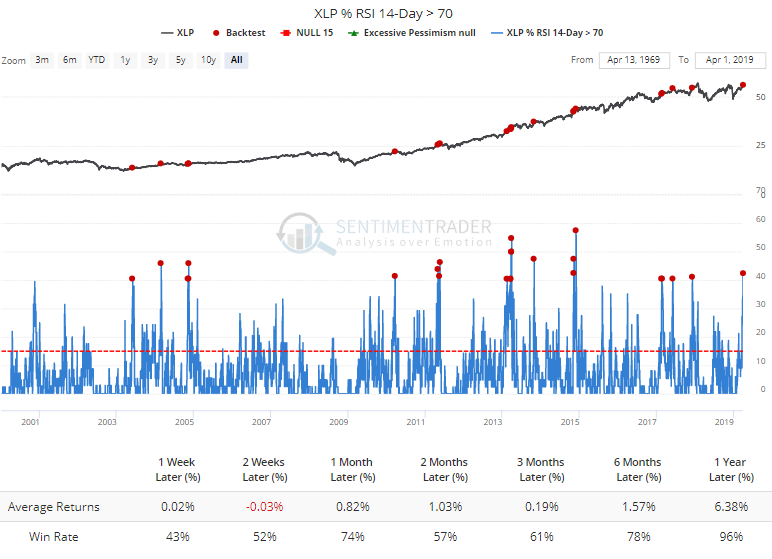
Among the breadth readings we track, there was a notable spike in the percentage of defensive-minded consumer staples stocks rallying enough to hit an overbought reading. That has tended to lead to some shorter-term declines and mostly meager returns for the stocks over the next few months.
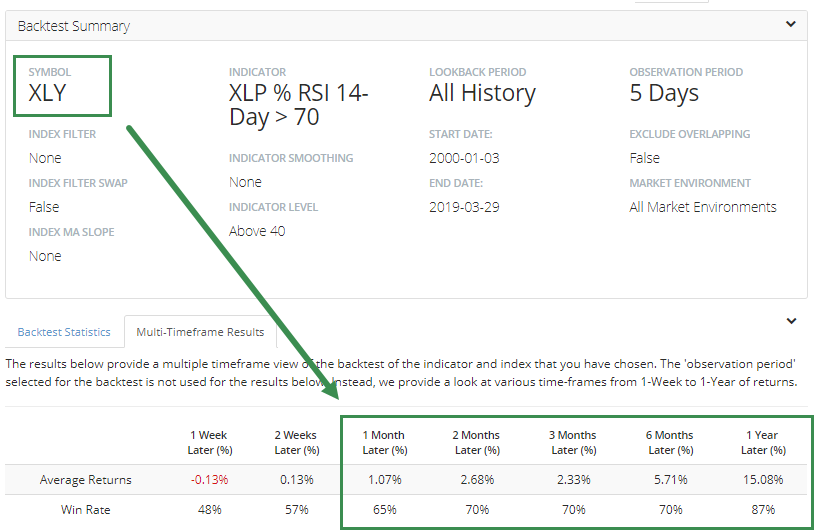
If we assume that a spike in defensive stocks likely meant a decline in cyclical ones, then if we run the same test but look at returns in XLY instead of XLP, returns were much better though a bit less consistent.
Unseasonable Pessimism
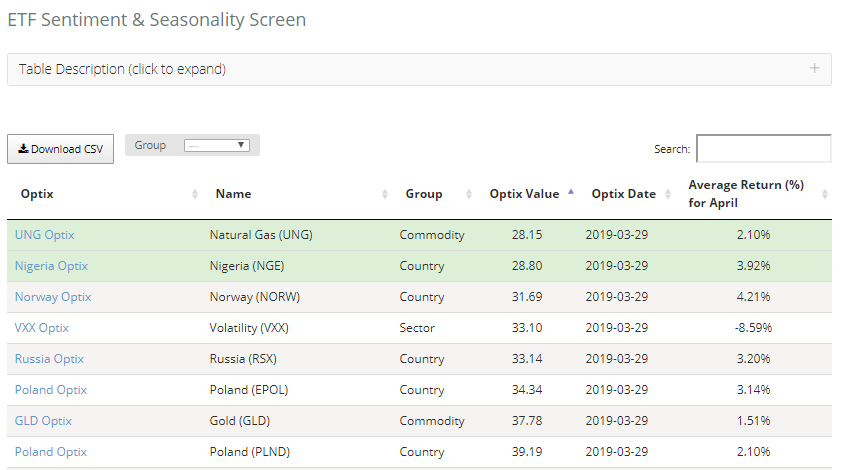
The screens are showing few ETFs or commodities with heavy pessimism entering a traditionally good time of the year. Only two ETFs have an Optimism Index below 30 that also have a historically positive return during April.
Same with commodities.
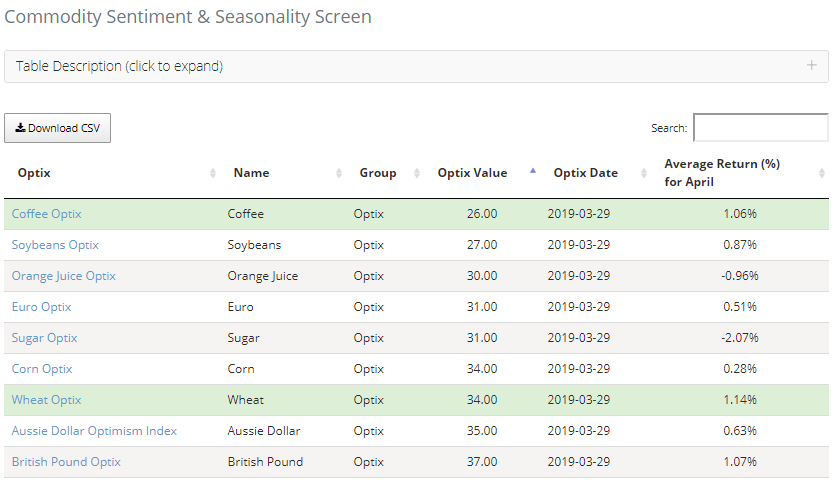
There aren't any with high optimism during a seasonally negative April because most assets rise this time of year.