Products
SentimenTrader Trading Tools
‍
Backtest Engine
My Trading Toolkit
Correlation Analysis
Seasonality
Indicators & Data API
‍
Proprietary Indicators & Charts
Market Data API
Strategies & Scanner
‍
50+ Trading Strategies
Smart Stock Scanner
Research Reports
‍
Research Solutions
Reports Library
Free Resources
Simple Backtest Calculator
Simple Seasonality Calculator
The Kelly Criterion Calculator
Sentiment Geo Map
Public Research Reports
Pricing
Company
About
In the News
Testimonials
Client Success Stories
Contact
Log inLoginSign up
< BACK TO ALL REPORTS

Monday Midday Color

Jason Goepfert
2019-02-25
null

Here's what's piquing my interest so far today.

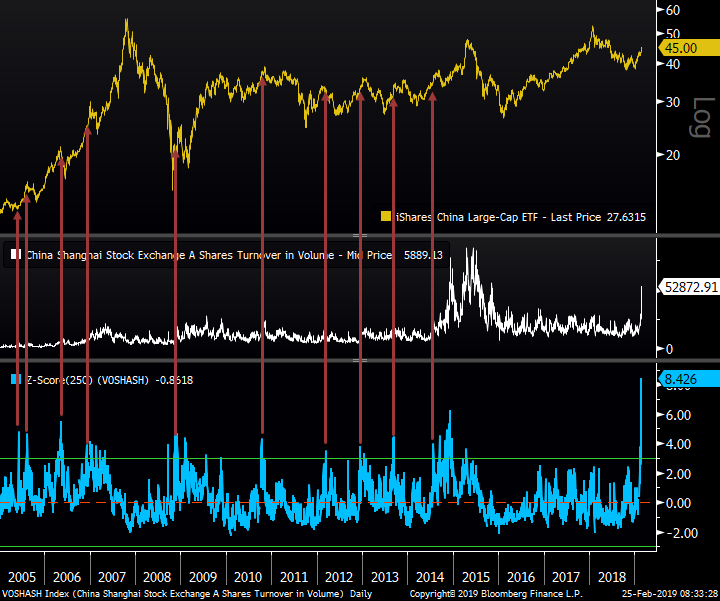
As noted by Bloomberg, volume in Chinese A-shares spiked on the President Trump's optimistic trade tweets. Unlike most other markets, volume in Chinese shares tends to spike on rallies, not declines. Today's volume was 8 standard deviations above the 1-year average, the highest ever.

Other spikes tended to precede short-term plateaus in FXI, the most-established U.S.-based fund tracking Chinese shares. The volume is not directly related to the shares tracked in FXI, but if we make the assumption that a-shares volume is a reflection of enthusiasm for Chinese shares in general, it can make sense to compare them. Reasonable people could certainly disagree.

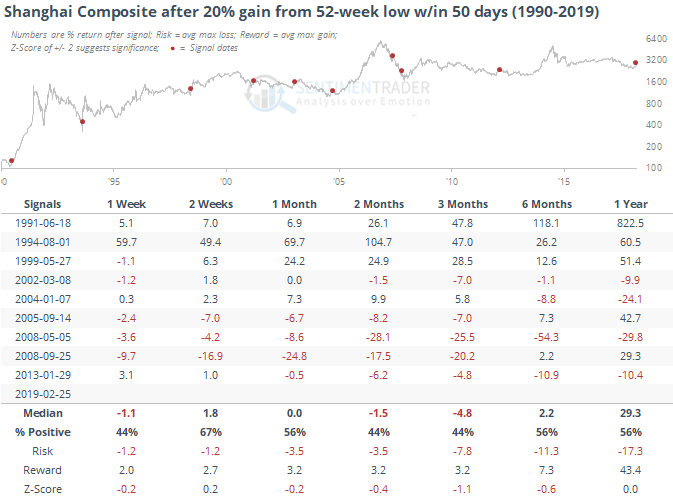
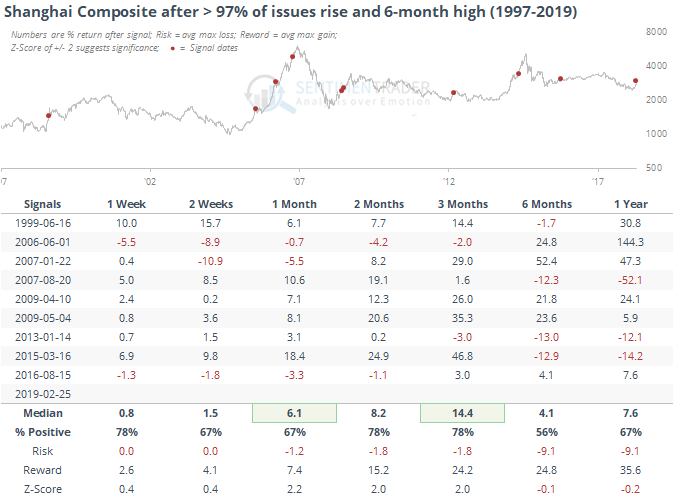
The rally in China has pushed the Shanghai Composite more than 20% off its 52-week low, within only 50 days of that low being set. The past few times, rallies like this have led to a pullback, while prior to 2005, it was the initial kick-off move to something larger. Watching to see if buyers persist in the week(s) ahead should be telling which is the better set of precedents now.

The rally was almost universal, with only 2 stocks in the Shanghai Composite declining on the day. That's one of the most lopsided sessions in over 20 years.

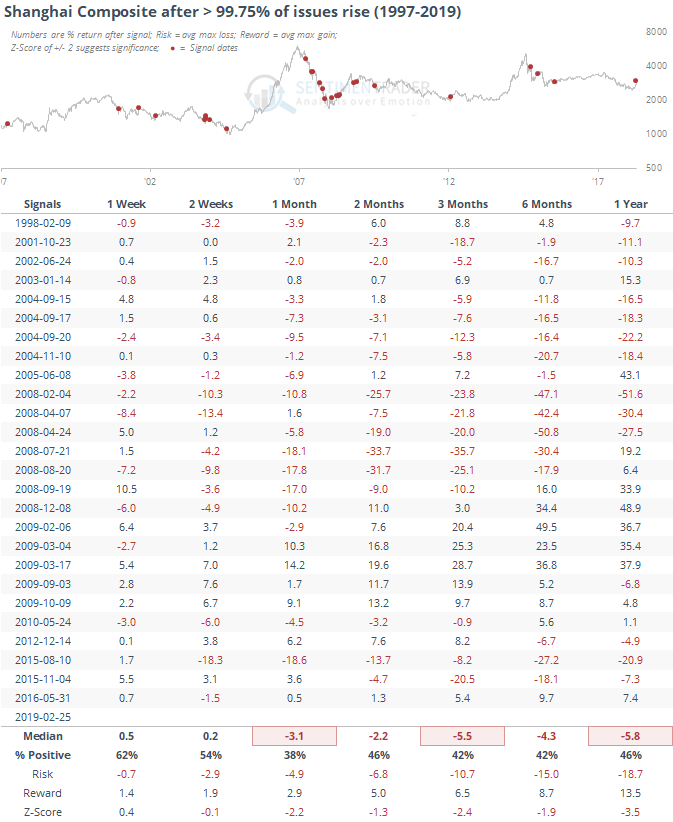
That doesn't look encouraging, but it gets quite a bit better when we look at the best breadth days when the Shanghai was also trading at at least a 6-month high at the time (which eliminates most of the bear market readings).

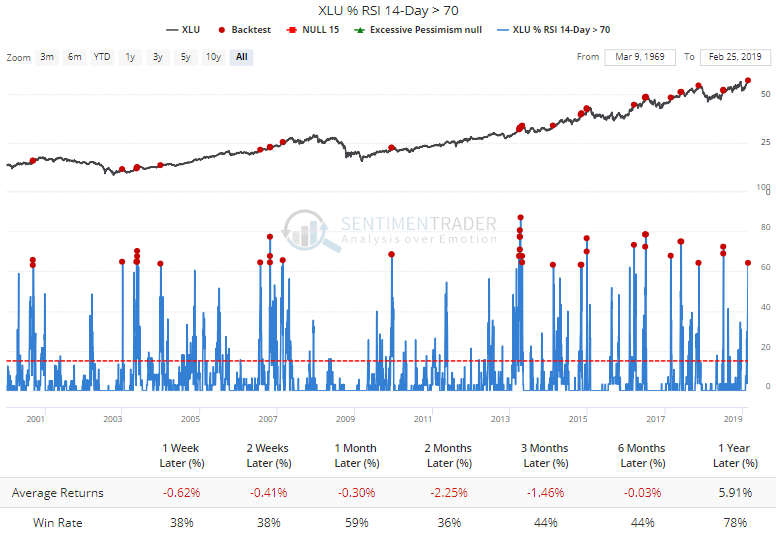
Utilities have been on quite a tear, with more than 60% of them currently showing overbought RSI conditions. XLU has not held up very well after other times these normally staid stocks have enjoyed such a move.

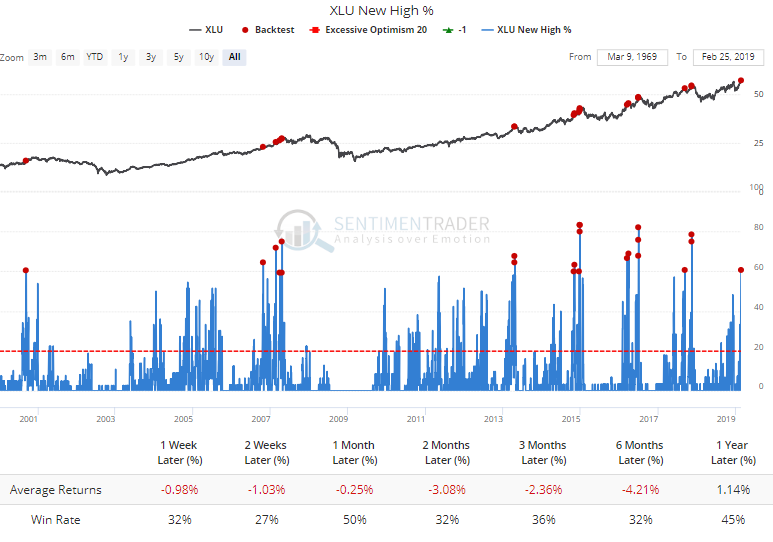
The move has triggered new 52-week highs in 60% of these stocks, a rarely-achieved level that has also tended to coincide with exhaustive buying pressure.

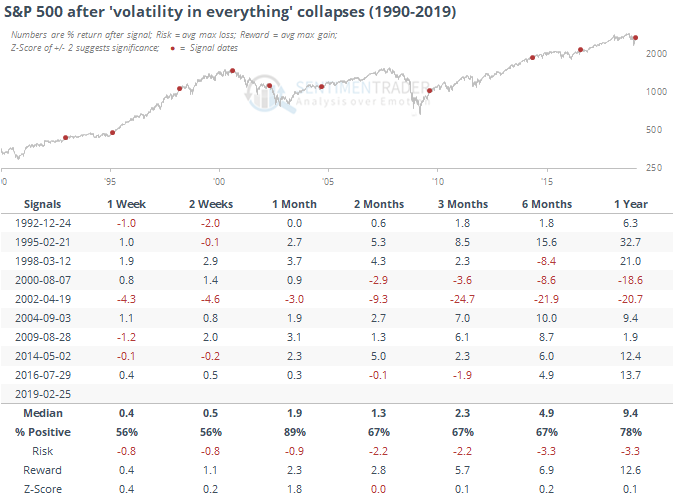
There has been a lot of chatter lately about not only the VIX, but also MOVE, the bond market volatility gauge which is nearing all-time lows. But it's been pretty much everything, as most volatility gauges are nearing their lows again.

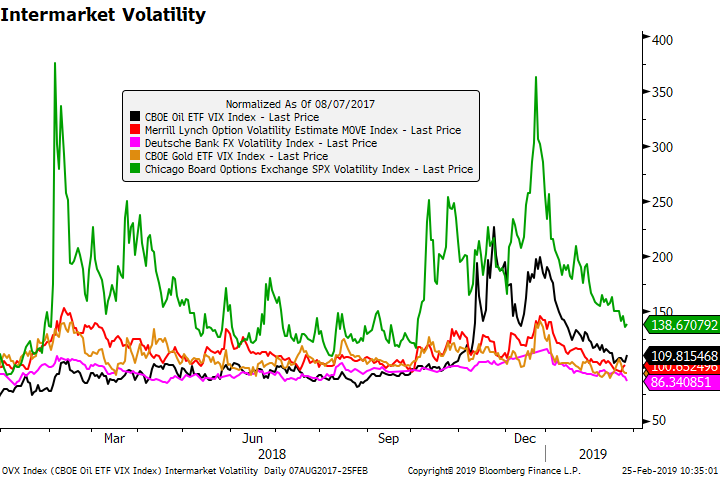
When the "volatility in everything" has collapsed before, it wasn't necessarily a sell signal for stocks. Mostly random. These are times when the average implied volatility for the markets in the chart above fell to the bottom 10% of the 52-week range.

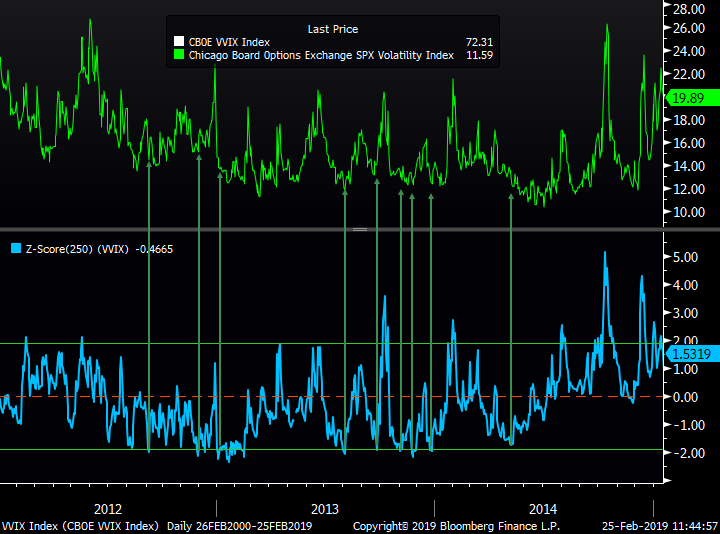
Even the volatility of the VIX has collapsed. The VVIX index is down to its lowest level in years. Expressed as standard deviations from its one-year average, VVIX is nearly 2 deviations from average (lower green band).

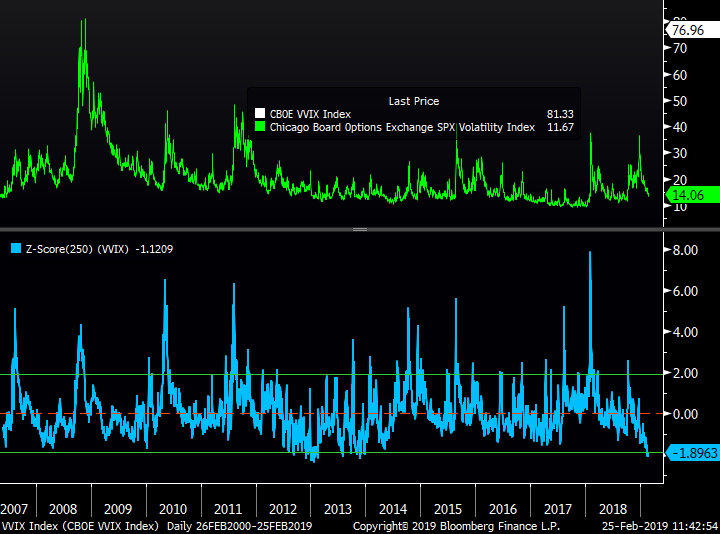
The only time period when it got this low was in 2012-2014, typically leading to a spike in the VIX sooner rather than later (again, however, it's questionable to try to trade this using any of the popular volatility ETFs which degrade quickly if held beyond a few days).

Sorry, you don't have access to this report

Upgrade your subscription plan to get access
Go to Dasboard
PRODUCTS
SentimenTrader
Trading Tools
Indicators & Data API
‍
Strategies & Scanner
‍
Research Reports
FREE
RESOUrCES
Simple Backtest
Calculator
Simple Seasonality
Calculator
The Kelly Criterion
Calculator
Sentiment Geo Map
‍
Public Research Reports
‍
Pricing
Bundle pricing
‍
Announcements
‍
FAQ
COMPANY
‍
About
‍
In the News
‍
Testimonials
‍
Client Success Stories
CONTACT
‍
General Inquiries
‍
Media Inquiries
‍
Financial Professionals Inquiries
‍
© 2025 Sundial Capital Research Inc. All rights reserved.
Setsail Marketing
TermsPrivacyAffiliate Program
Risk Disclosure: Futures and forex trading contains substantial risk and is not for every investor. An investor could potentially lose all or more than the initial investment. Risk capital is money that can be lost without jeopardizing ones’ financial security or life style. Only risk capital should be used for trading and only those with sufficient risk capital should consider trading. Past performance is not necessarily indicative of future results.

Hypothetical Performance Disclosure: Hypothetical performance results have many inherent limitations, some of which are described below. No representation is being made that any account will or is likely to achieve profits or losses similar to those shown; in fact, there are frequently sharp differences between hypothetical performance results and the actual results subsequently achieved by any particular trading program. One of the limitations of hypothetical performance results is that they are generally prepared with the benefit of hindsight. In addition, hypothetical trading does not involve financial risk, and no hypothetical trading record can completely account for the impact of financial risk of actual trading. for example, the ability to withstand losses or to adhere to a particular trading program in spite of trading losses are material points which can also adversely affect actual trading results. There are numerous other factors related to the markets in general or to the implementation of any specific trading program which cannot be fully accounted for in the preparation of hypothetical performance results and all which can adversely affect trading results.

Testimonial Disclosure: Testimonials appearing on this website may not be representative of other clients or customers and is not a guarantee of future performance or success.