Monday Color - Discretionary Streak, Fund Exposure, Small Trader Enthusiasm, Earnings Season

Here's what's piquing my interest on a slow that, with some hints that buyers have reached exhaustion.
On A Roll
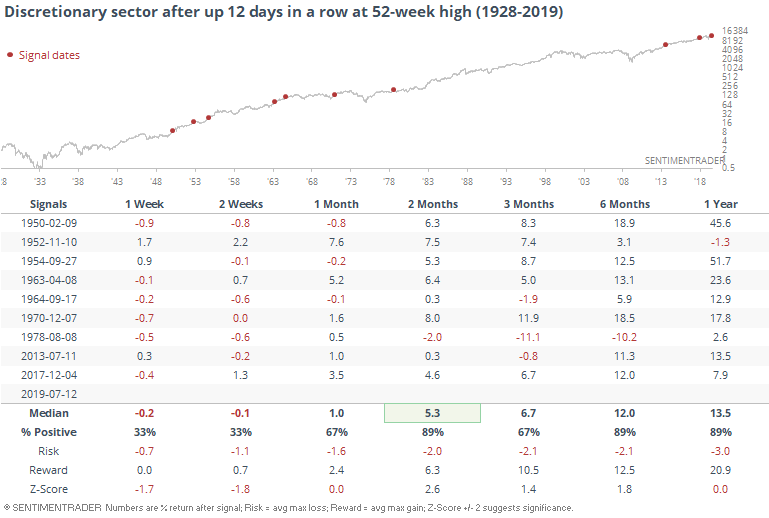
The WSJ notes that the consumer discretionary sector has risen for 12 straight days, one of its longest streaks ever. Indeed.
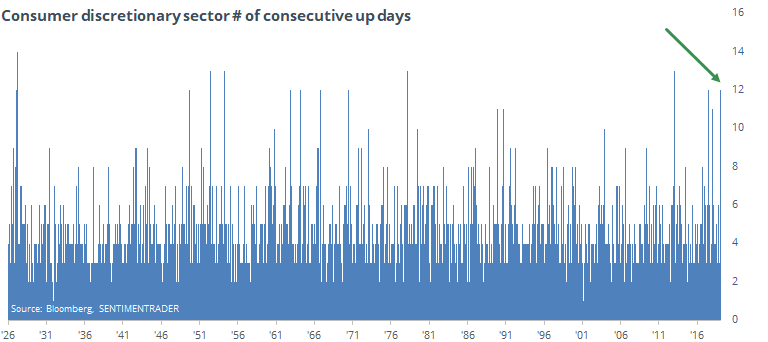
Momentum doesn't die easily, and that was the case after other times the sector managed to string together a run like this.
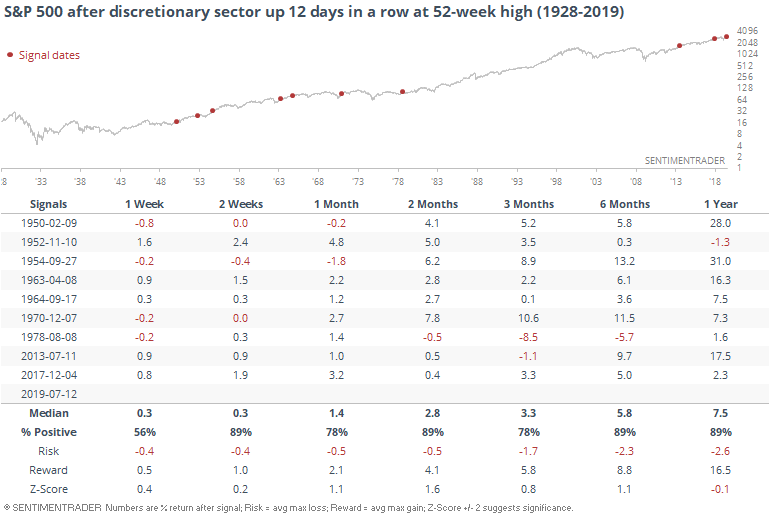
It was good for the broader market, too.
It's hard - maybe impossible - to square this with the warning signs given by other sectors, like small-caps, banks, and transports. When they lag like they have recently, stocks have mostly struggled. I'd tend to put more weight on those warnings, but that's something I typically do (put more weight on warnings than confirmations) and so far it has had zero impact in recent weeks.
Funds Coming Back
One of the compelling positives we discussed a month ago was the lack of exposure to stocks among hedge funds. That focused on equity funds with a longer-term time frame.
On the site, we follow macro and commodity-trading funds, which tend to be more aggressive, leveraged, and trend-following with a shorter time frame. And they have suddenly seen the light, going from 25% short exposure earlier this year to more than 50% long exposure by late last week.
That kind of aggression has precipitated several notable declines, but also failures during the remarkable momentum run in 2017.
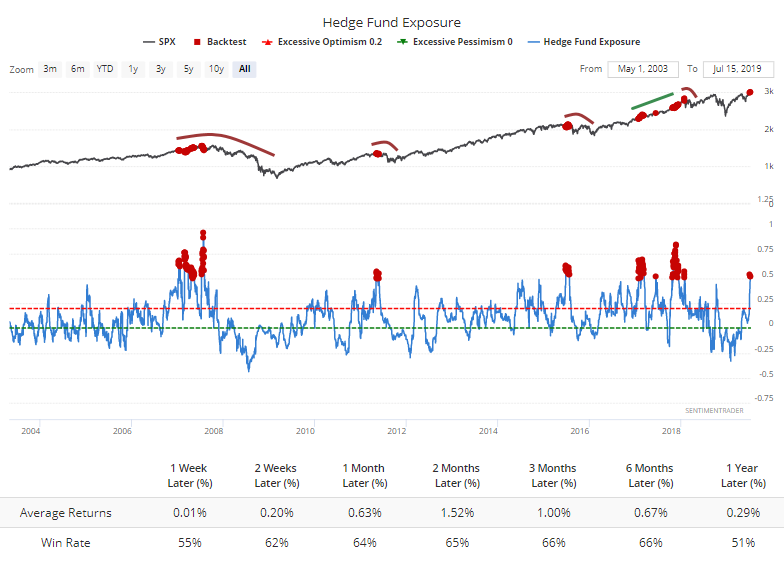
Looking at various levels of exposure, there has been a clear pattern of lower returns when exposure is higher.
This seems like a potential shorter-term negative, with the understanding that other types of hedge funds remain underinvested on a longer time frame, and that has been a boon to markets over a longer time frame.
Options Traders Coming Back, Too
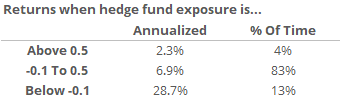
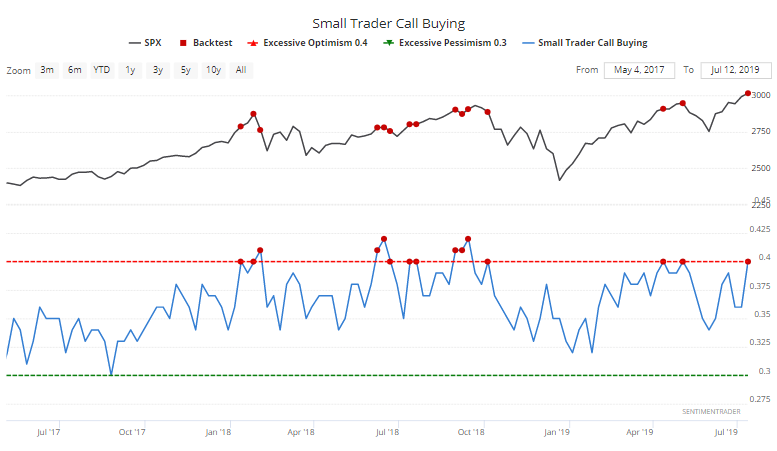
As stocks bottomed a little over a month ago and started to rally, we saw that small options traders were buying a lot of puts. A record amount, in fact.
They've been selling those and turning to calls. Last week, they spent more than twice as much on call option premiums than for puts. That's the most since the spring before markets started to stumble, but in 2017 and parts of 2018, didn't have any negative influence.
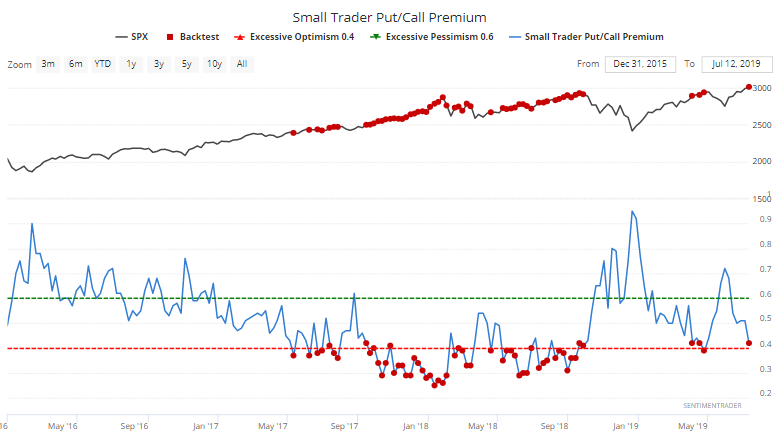
Longer-term, it's not that uncommon to see it at this level, but even so, the S&P averaged a negative return in the week(s) ahead.
It's annualized return was -1.0% after readings this low versus +18.7% when it was above the upper threshold of 0.6.
The reason for the big move in this indicator is that small traders have moved aggressively into calls. Last week, they spent 40% of their volume on bullish speculative call options, one of the most in the past few years.
It's actually among the most in almost 20 years, and that has not been kind to the S&P 500's forward returns.
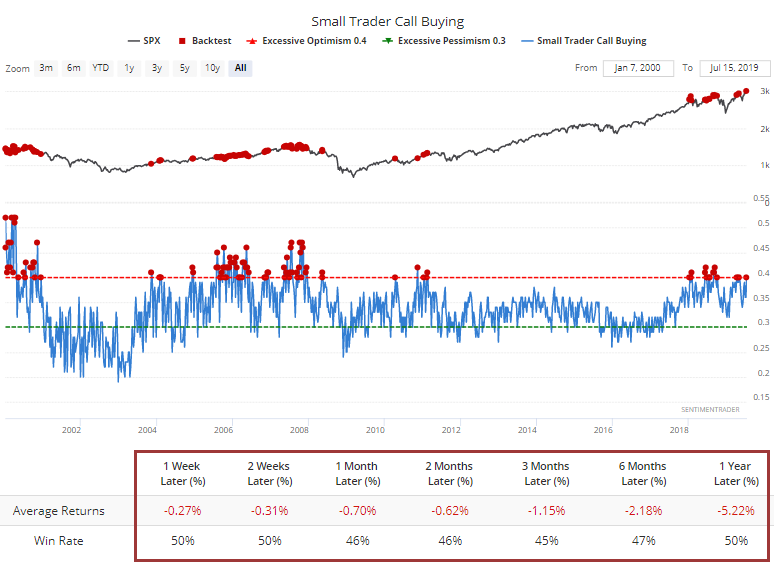
It's annualized forward return was -13.1% when these traders spent 40% or more of their volume on call options. Over the past 15 years, its annualized return was +21.2% when traders spent less than 30% of their volume on calls, so a wide disparity there.
Insiders Are Selling
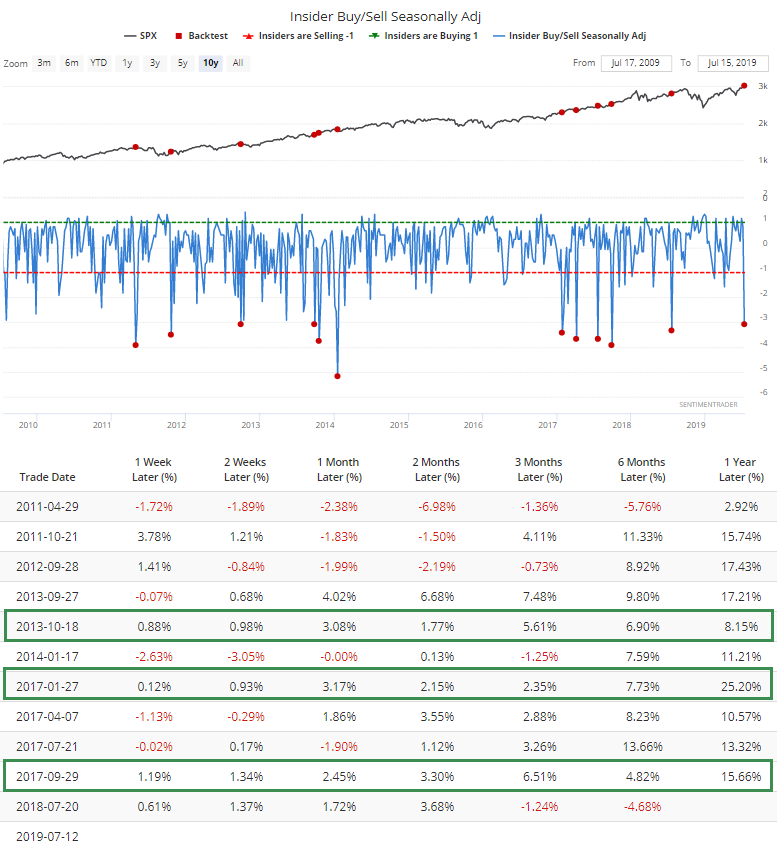
There was a spike in corporate insider selling last week, which is somewhat unusual as we head into earnings season. On a seasonally-adjusted basis, it was 3 standard deviations from normal.
This hasn't been a death knell for rallies, but it's at least worth mentioning that the only times stocks managed to rise uninterrupted after spikes like this were during the ultra-momentum markets in 2013 and 2017.
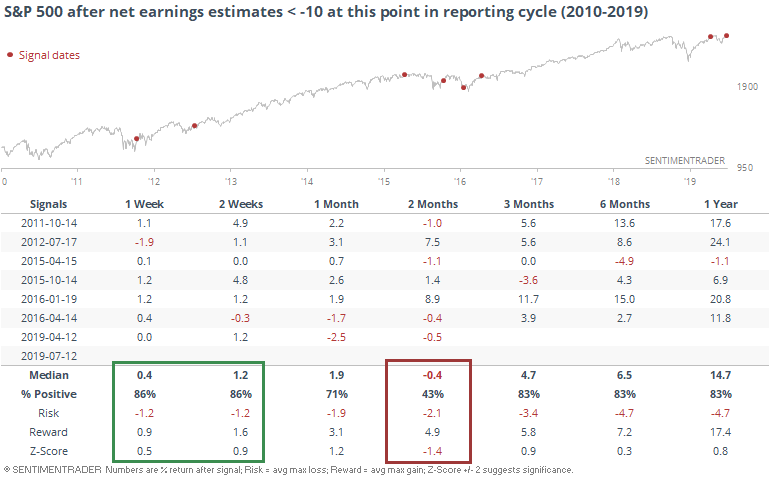
Analysts Not Bullish, Either
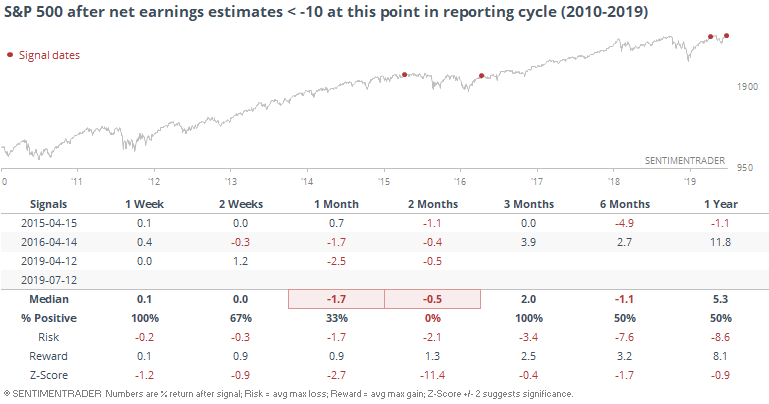
Over the past month, Wall Street analysts have been busy downgrading the earnings potential of the stocks they cover as we head into earnings reporting season. The net number of earnings upgrades vs downtrends has sunk to an average of more than 10 downgrades per day, one of the lower readings since 2010.
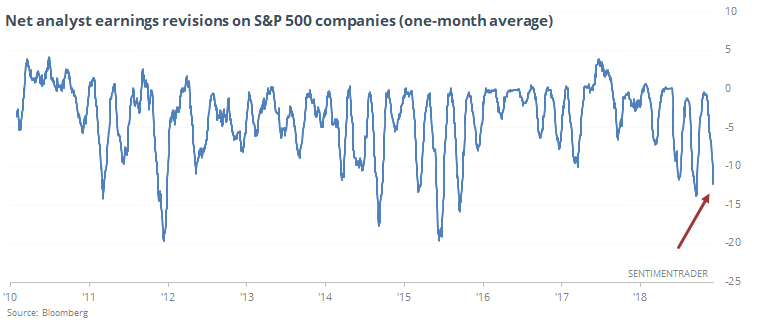
At this point in the earnings reporting cycle - about two weeks following the end of a quarter - there have been a handful of times the net revisions have been this low. It was a positive for the next couple of weeks, but not so much the next couple of months.
Most of those positive returns came when stocks had been struggling, though. There were only 3 times it triggered when stocks were sitting at or near new highs, and those were not positive.