Monday Color - Breadth whipsaws, small traders, surprise spread, bond sentiment

Here's what's piquing my interest as stocks try to recover from some overnight panic.
Whipped
One of the ways in which the volatility we've seen over the past week is similar to August is the reaction to economic data. The probability of a rate cut spiked, just like it did when markets suffered a mini-tumble in August.
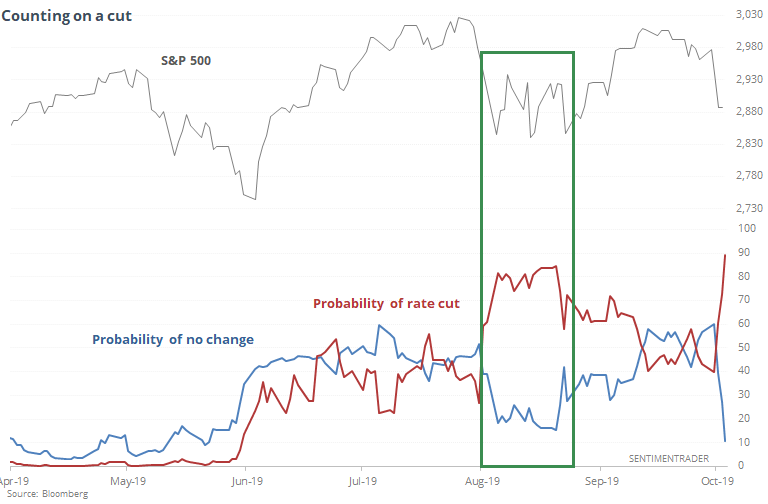
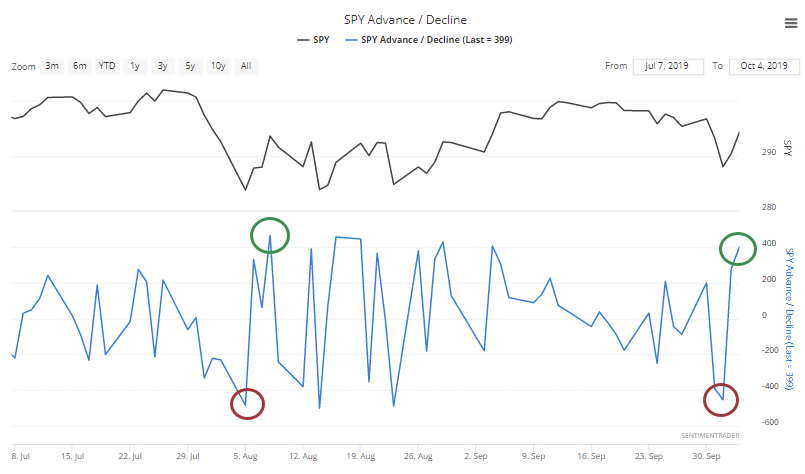
The reactions caused traders to go all-out, then all-in, within a matter of days, both times. Troy looked at a similar effect using broader NYSE data over the weekend.
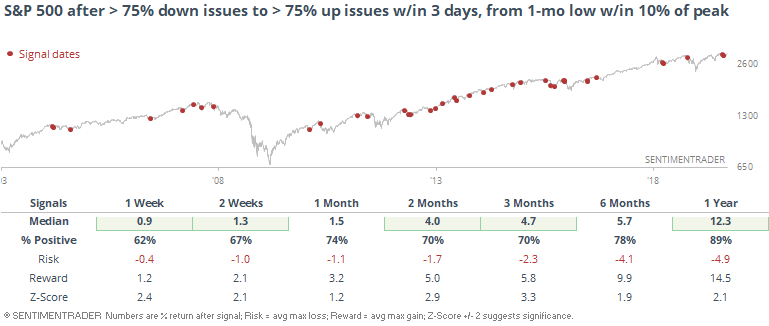
When behavior likes this comes on the heels of at least a one-month low when within 3% of a 52-week high, it has led to some mixed shorter-term returns, but better-than-average in the medium- to long-term.
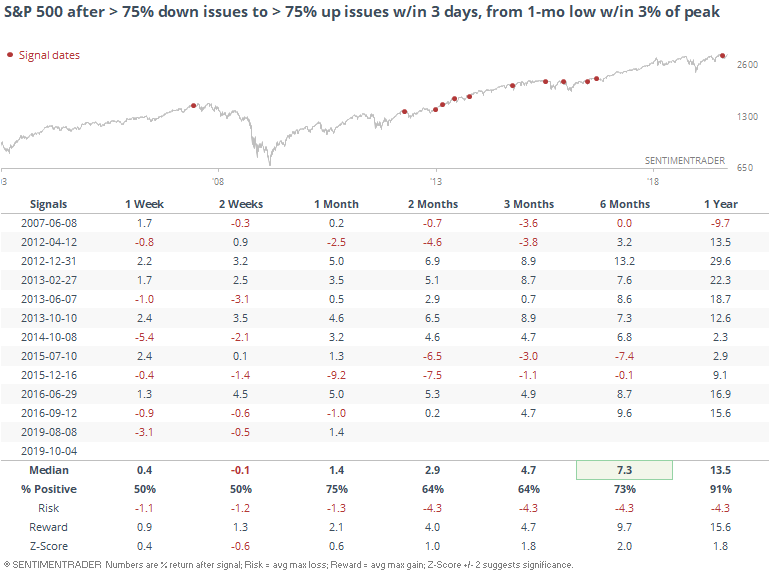
Loosening the parameters to get a larger sample size naturally reduces the returns a bit but the overall pattern remained the same. For example, here are the returns when looking at similar reversals when the S&P was within 10% of its peak (instead of within 3%).
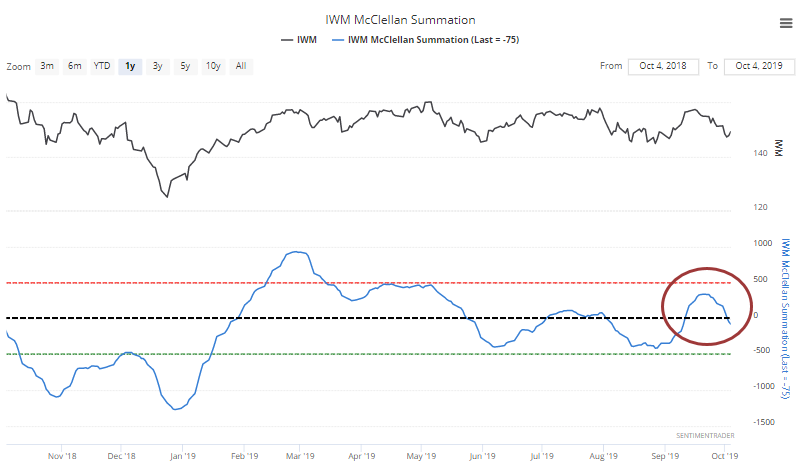
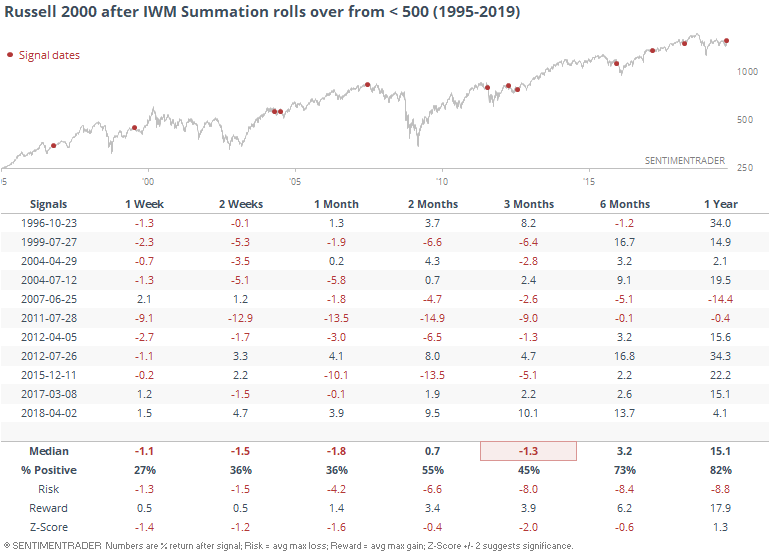
While the S&P enjoyed a big upside reversal from what had been a very short-term oversold condition, longer-term momentum underlying the small-cap Russell 2000 has rolled over again. The McClellan Summation Index dropped below 0 after being above for only a few weeks and not managing to get above +500. That shows relatively weak momentum.
That didn't serve the index too well over the next few weeks, but there were no ill effects longer-term.
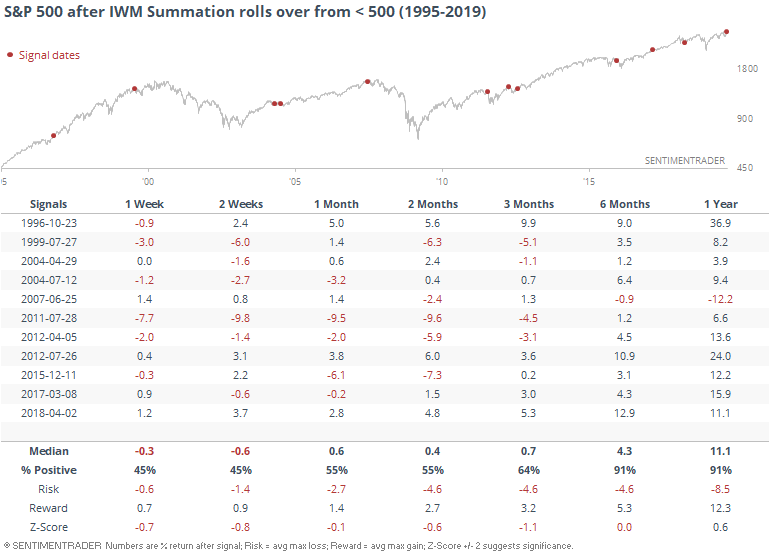
Here's how the S&P fared.
Small Traders, Again
I know I've harped on this a lot in recent weeks, and call buying is still relatively high, but once again last week, the smallest of options traders spent more than a quarter of their volume on purchasing protective puts. We've typically only seen this around longer-term lows.
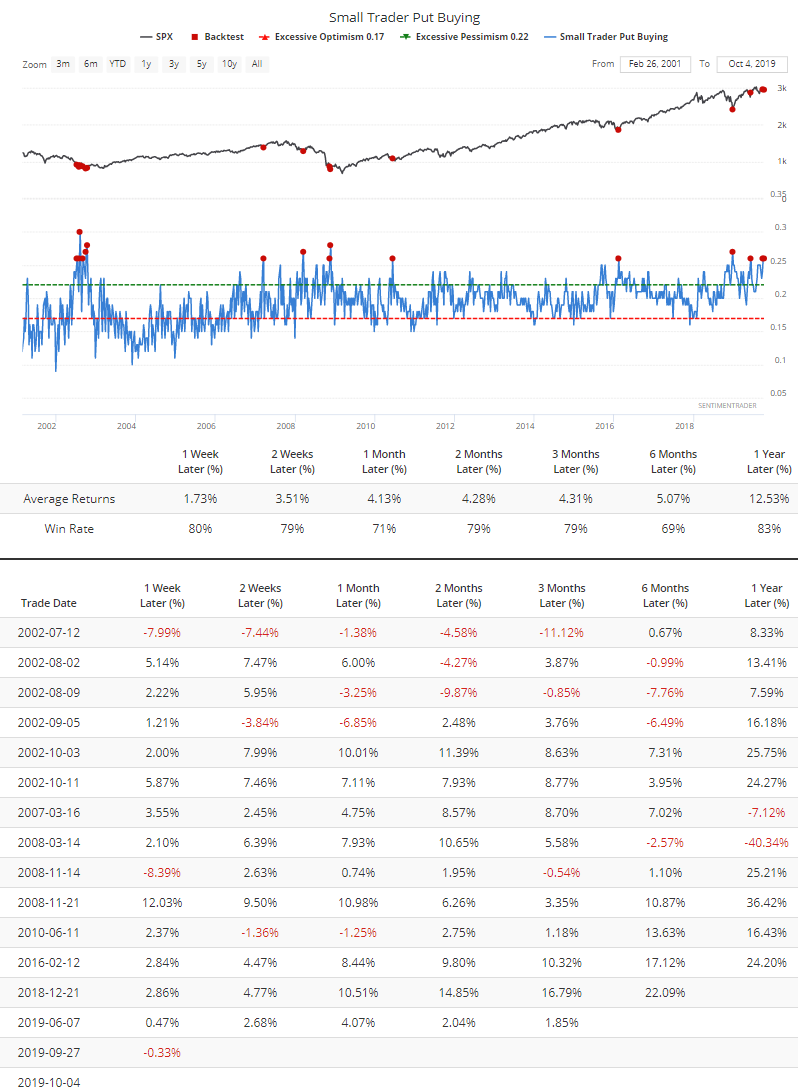
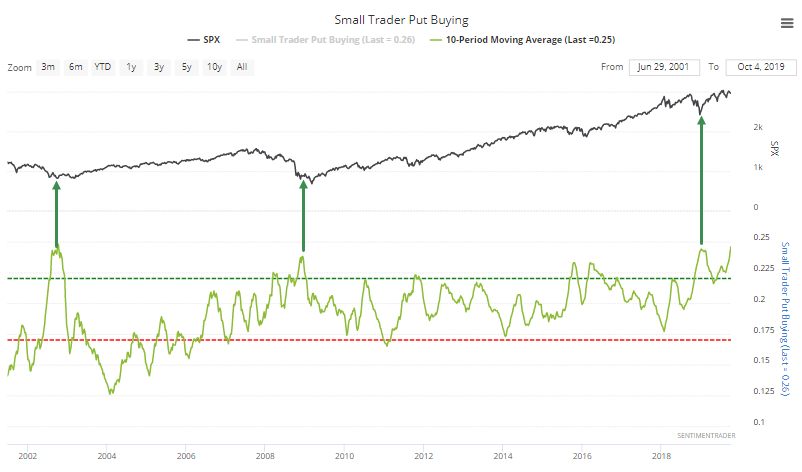
It has been so high and so persistent that the 10-week average of their put buying just set a new record high, dating back to 2000. The three other times it neared this kind of extreme were all notable.
It's dangerous to put too much weight on a single indicator, but this one is awfully compelling and has been for weeks on end.
USA! USA!
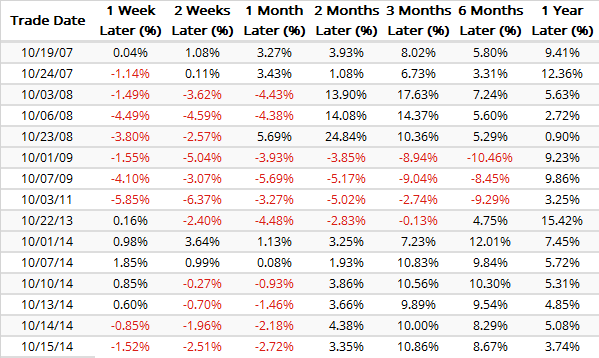
The WSJ notes that economic surprises in the U.S. have been far ahead of those for other regions. Indeed it had, but the spread is starting to reverse.
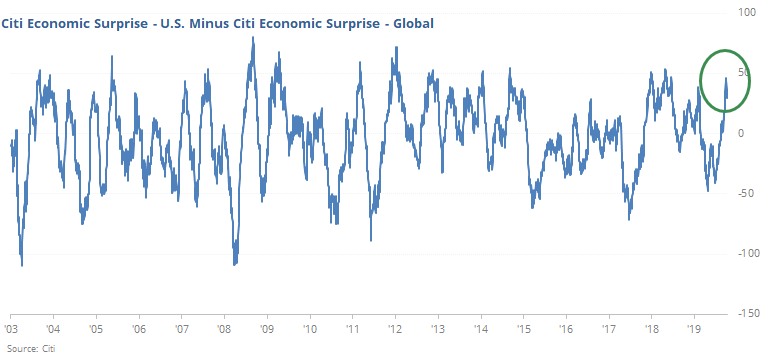
We've looked at this type of spread many times over the years, usually with returns that only mildly support the narrative that usually accompanies charts like this.
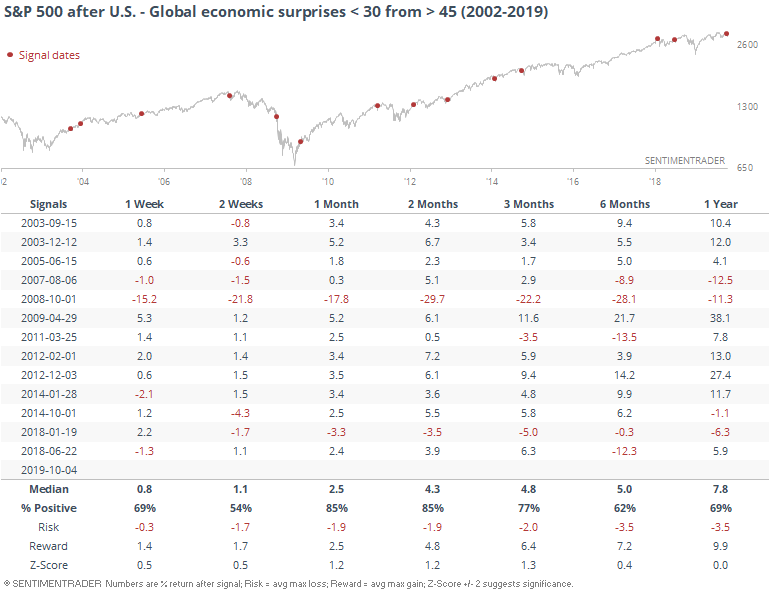
Here is how the S&P 500 has fared after similar spreads eased.
On a relative basis, here is how stocks in the U.S. fared relative to stocks outside the U.S.
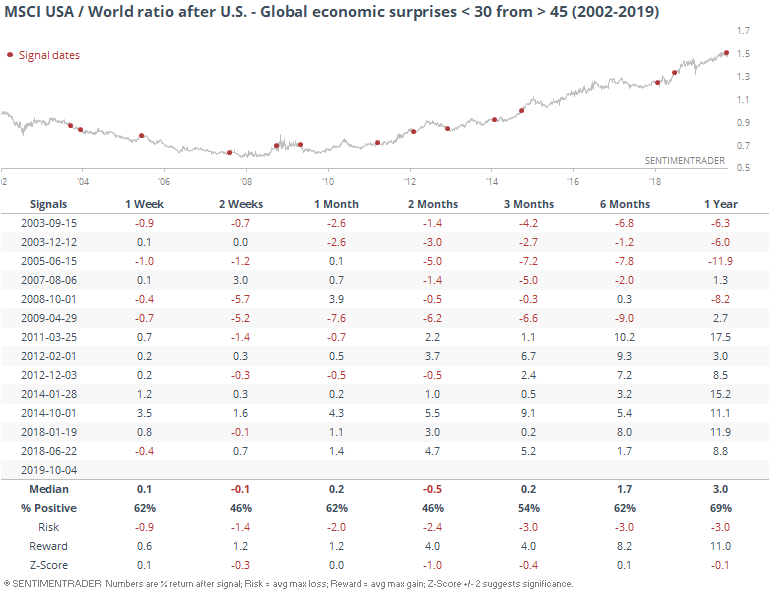
There was no consistent pattern, with the U.S. alternating periods of out- and under-performance relative to foreign equities.
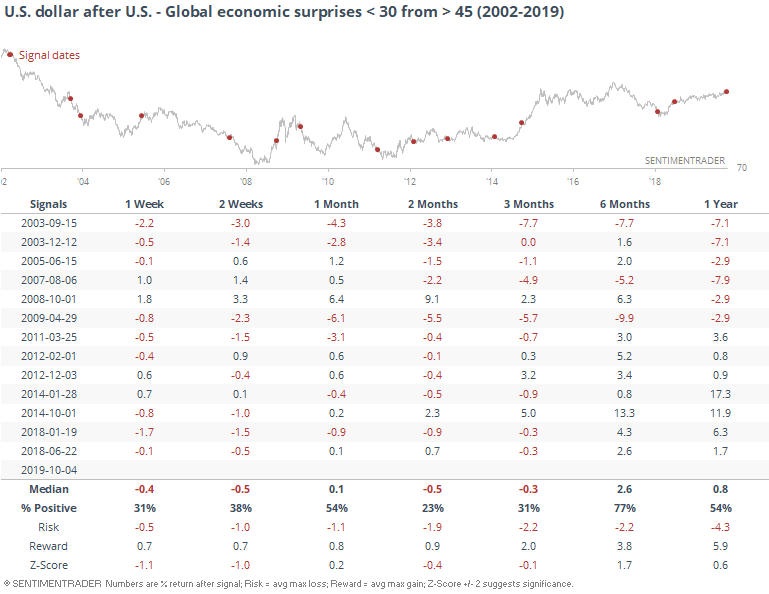
The dollar was mixed after the spread moved above 45, but once it started to reverse, the buck suffered over the next 2-3 months.
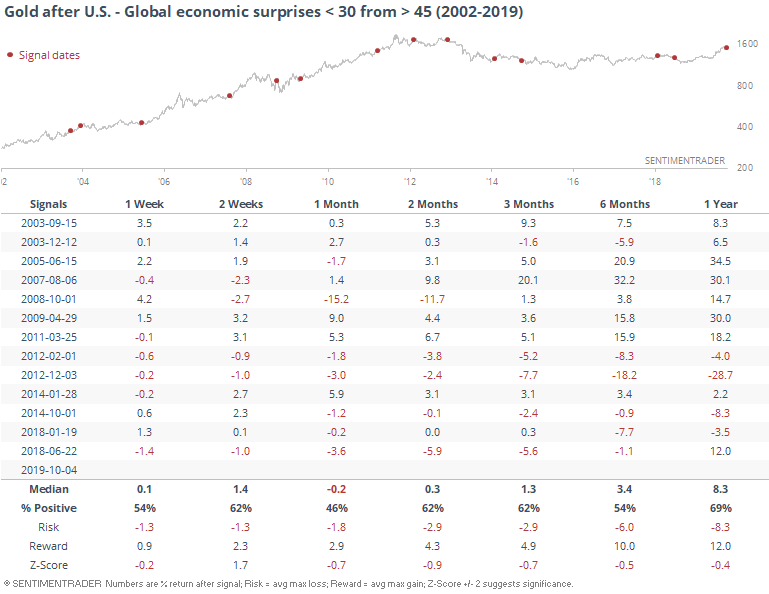
Gold bugs did not have a great time once the spread had reached an extreme, but after it started to reverse, returns improved. They still weren't great.
Oil Slick
Sentiment on oil plunged last week. It had been holding near neutral despite the slide in prices, then took a sharp turn lower.
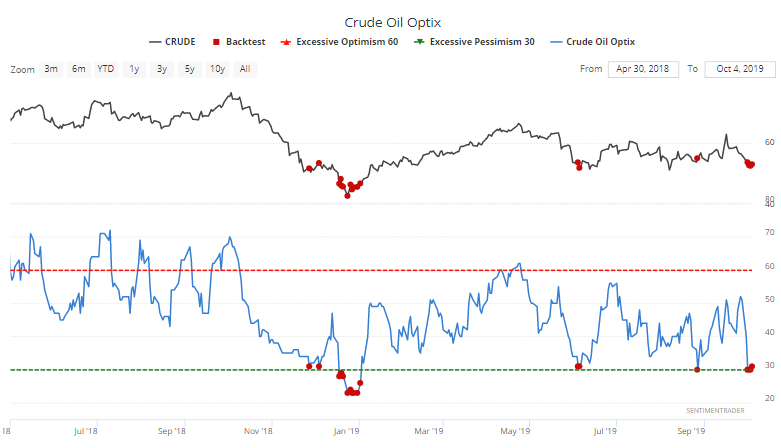
This is a market where fundamental or structural issues can easily overwhelming any other factors, and an Optimism Index this low was not reliable enough as a contrary indicator.
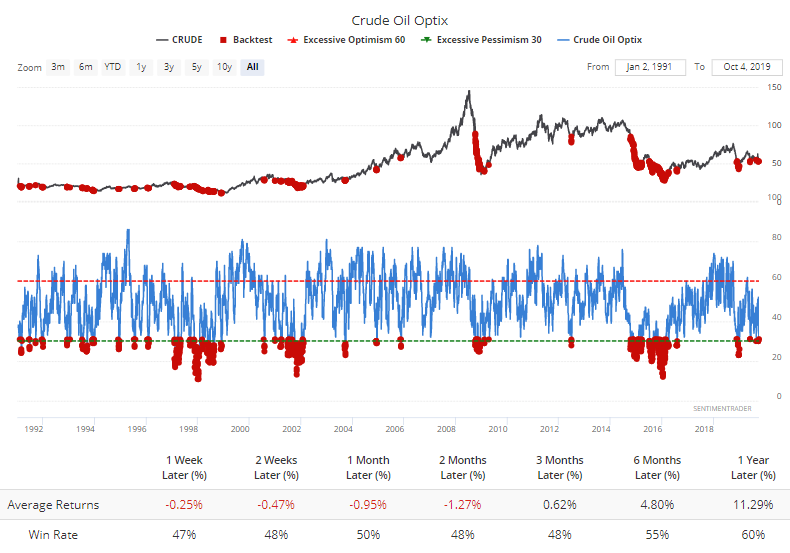
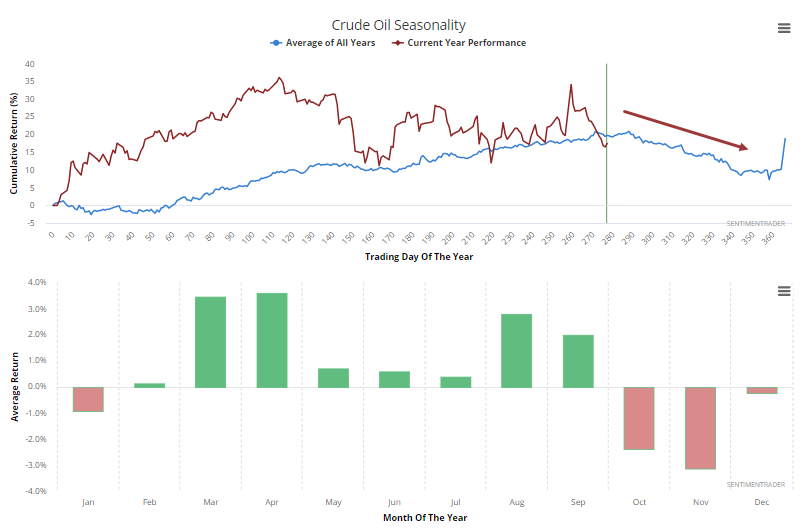
It's seasonal pattern isn't exactly encouraging, either.
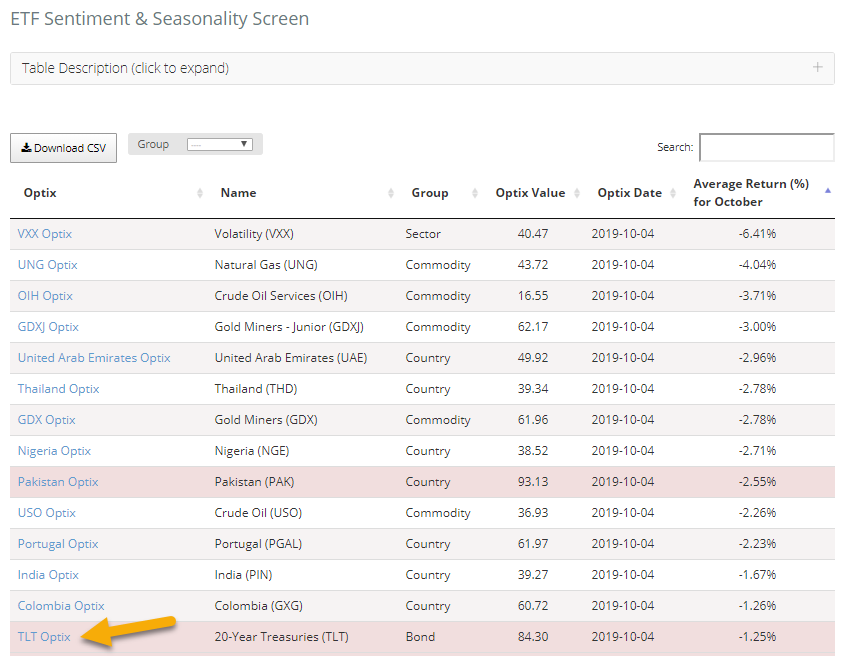
October Bonds
Speaking of seasonality, the TLT fund is showing up on the Sentiment & Seasonality screen, as it has high optimism during a month with a negative average return.
October has been a rare weak spot for the fund.
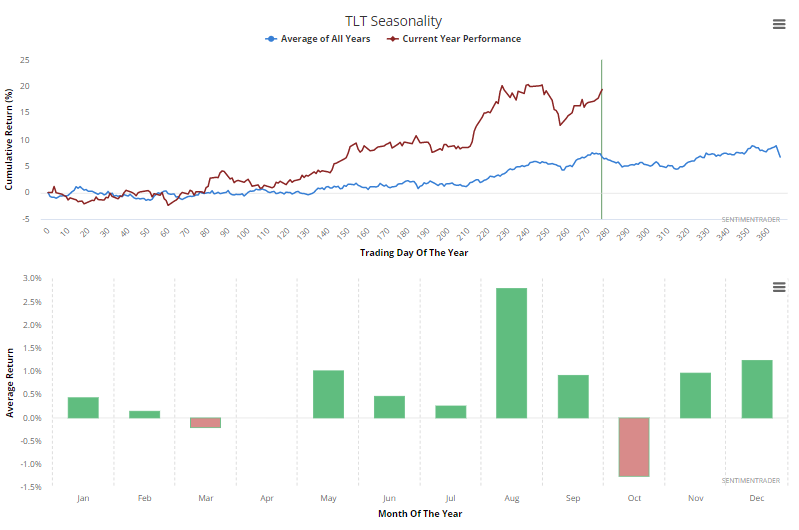
When the Optimism Index was this high during October, its returns over the next 2-4 weeks were mostly negative.