Products
SentimenTrader Trading Tools
‍
Backtest Engine
My Trading Toolkit
Correlation Analysis
Seasonality
Market Prediction
Indicators & Data API
‍
Proprietary Indicators & Charts
Market Data API
Strategies & Scanner
‍
50+ Trading Strategies
Smart Stock Scanner
Smart Option Scanner
Research Reports
‍
Research Solutions
Reports Library
Free Resources
Simple Backtest Calculator
Simple Seasonality Calculator
The Kelly Criterion Calculator
Sentiment Geo Map
Public Research Reports
Education
Sentiment Indicators
Technical Indicators
Pricing
Company
About
In the News
Testimonials
Client Success Stories
Contact
Log inLoginSign up
< BACK TO ALL REPORTS

Momentum turns negative for the commodity with a Ph.D. in economics

Dean Christians
2022-04-26
The 252-day rate of change for copper futures surged above 100% and subsequently reversed below 0%. Let's assess the outlook for copper, commodities, and stocks.

Key points:

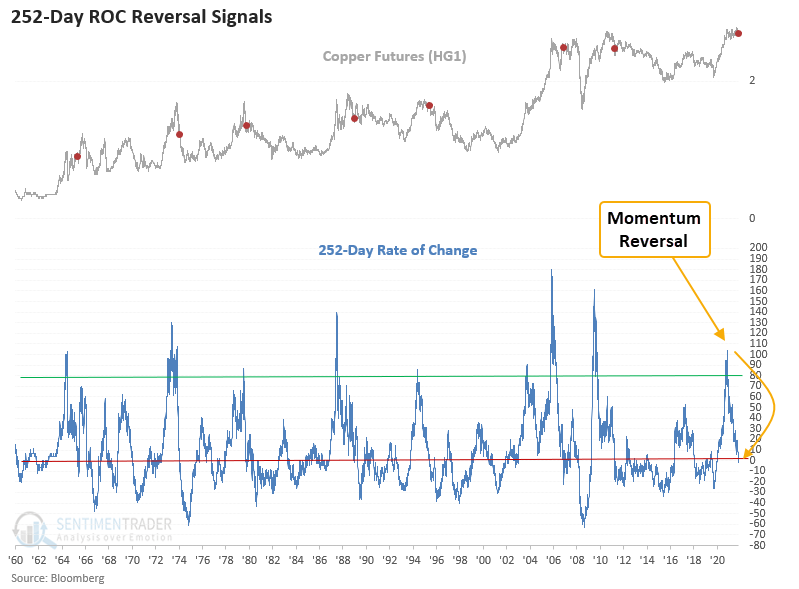
  • Copper momentum has turned negative on a rolling 1-year basis
  • The price momentum reversal occurred after copper rallied more than 100%
  • Similar conditions preceded weak performance for copper across multiple time frames

Momentum turns negative for the commodity with a Ph.D. in economics

Let's conduct a study to assess the outlook for copper, commodities, and stocks when the 252-day rate of change for copper exceeds 80% and then reverses below 0%.

Copper, like most commodities, rarely maintains a bullish trend for an extended period. The 2002-08 cycle is the exception.

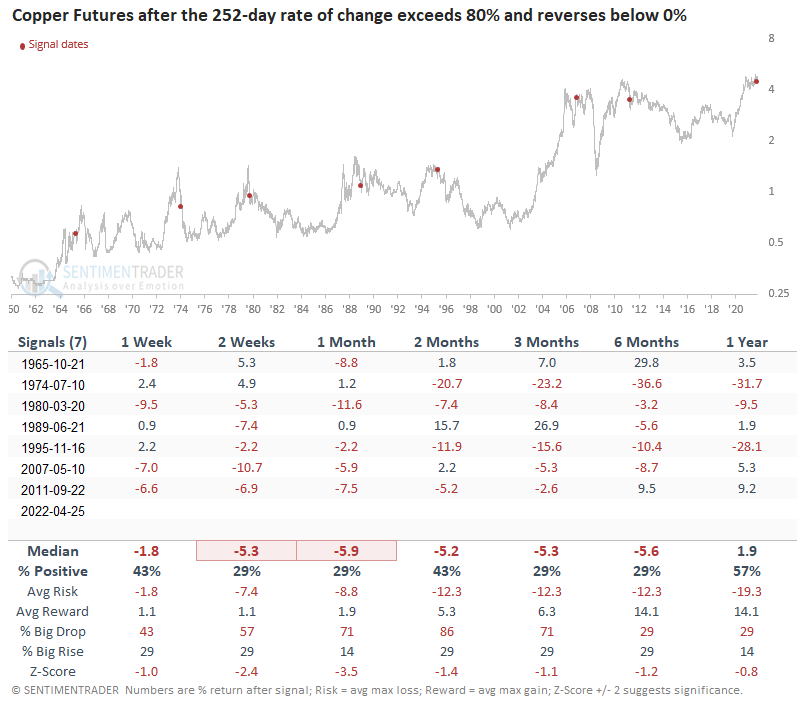
Similar reversals in momentum preceded negative returns

This study generated a signal 7 other times over the past 57 years. After the others, copper returns, win rates, and risk/reward profiles look unfavorable across short to medium-term time frames. The reversal in momentum marked a significant peak in copper in 5 out of 7 instances. 1965 and 2007 are the only signals that recovered and eventually recorded a new high. The sample size is small.

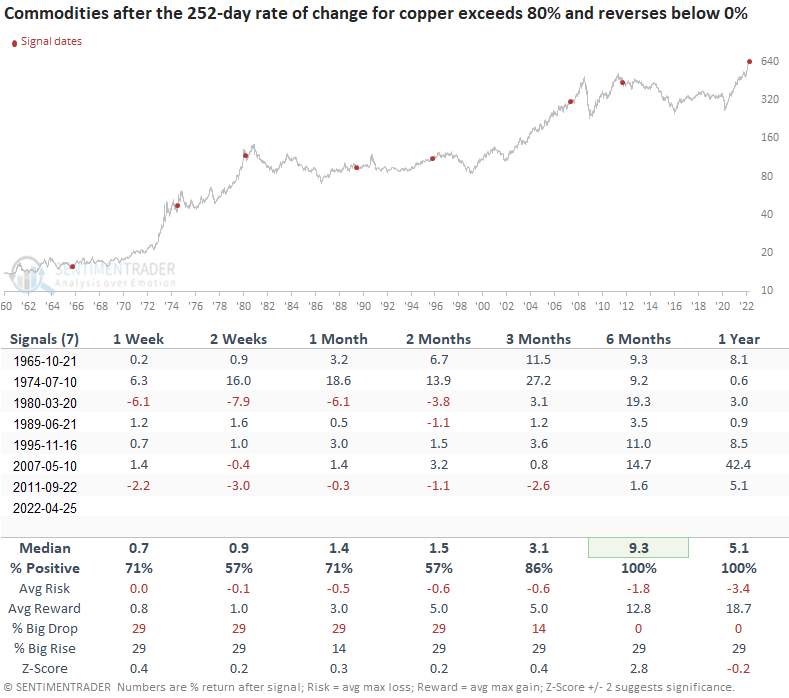
Similar reversals in copper momentum preceded positive returns for commodities

When I apply the copper signal dates to the Bloomberg Commodity Spot Index, the outlook table suggests that a broad basket of commodities can continue to rally. The 6-month time frame looks excellent.

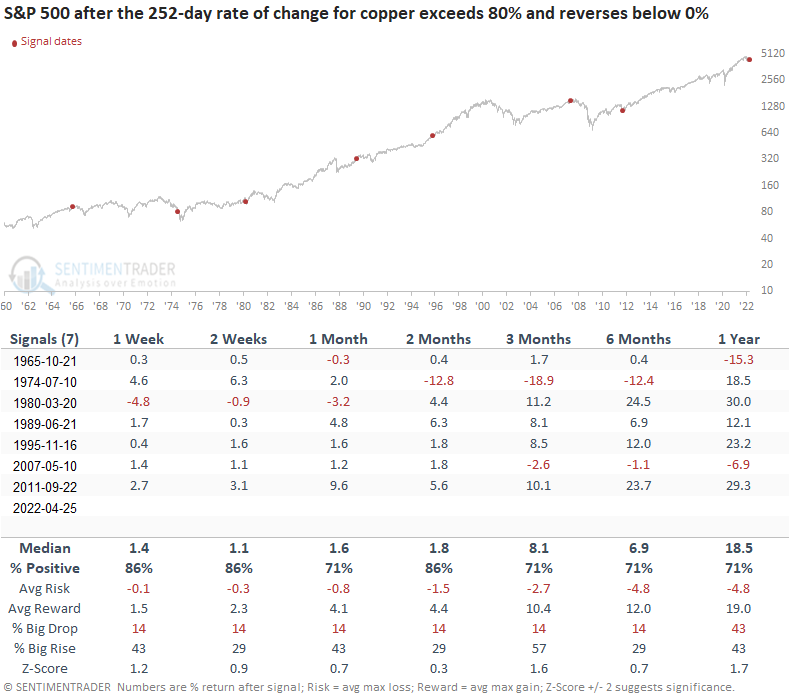
Similar reversals in copper momentum preceded positive returns for stocks

The outlook table looks constructive when applying the copper signal dates to the S&P 500 Index. Several time frames show an 86% win rate. However, I would note that returns are somewhat limited in the first few months.

What the research tells us...

When the 252-day rate of change for copper exceeds 80% and then reverses below 0%, the shift in momentum typically leads to more adverse price action for copper. Similar setups to what we're seeing now have preceded unfavorable copper performance, win rates, and risk/reward profiles across short to medium-term time frames. If we apply the signals to commodities or the S&P 500, forward returns look significantly better in both cases.

PRODUCTS
SentimenTrader
Trading Tools
Indicators & Data API
‍
Strategies & Scanner
‍
Research Reports
FREE
RESOUrCES
Simple Backtest
Calculator
Simple Seasonality
Calculator
The Kelly Criterion
Calculator
Sentiment Geo Map
‍
Public Research Reports
‍
Education
Sentiment Indicators
‍
Technical Indicators
‍
Pricing
Bundle pricing
‍
FAQ
‍
Announcements
‍
COMPANY
‍
About
‍
In the News
‍
Testimonials
‍
Client Success Stories
CONTACT
‍
General Inquiries
‍
Media Inquiries
‍
Financial Professionals Inquiries
‍
© 2026 Sundial Capital Research Inc. All rights reserved.
Setsail Marketing
TermsPrivacyAffiliate Program
Risk Disclosure: The information and tools provided are for research and analytical purposes only and are not intended as investment advice. Market analysis involves uncertainty, and outcomes may differ from expectations. Users should conduct their own due diligence and consider their individual circumstances before making any financial decisions. Past performance is not necessarily indicative of future results.

Hypothetical Performance Disclosure: Hypothetical performance results have many inherent limitations, some of which are described below. No representation is being made that any account will or is likely to achieve profits or losses similar to those shown; in fact, there are frequently sharp differences between hypothetical performance results and the actual results subsequently achieved by any particular trading program. One of the limitations of hypothetical performance results is that they are generally prepared with the benefit of hindsight. In addition, hypothetical trading does not involve financial risk, and no hypothetical trading record can completely account for the impact of financial risk of actual trading. for example, the ability to withstand losses or to adhere to a particular trading program in spite of trading losses are material points which can also adversely affect actual trading results. There are numerous other factors related to the markets in general or to the implementation of any specific trading program which cannot be fully accounted for in the preparation of hypothetical performance results and all which can adversely affect trading results.

Testimonial Disclosure: Testimonials appearing on this website may not be representative of other clients or customers and is not a guarantee of future performance or success.