Products
SentimenTrader Trading Tools
‍
Backtest Engine
My Trading Toolkit
Correlation Analysis
Seasonality
Market Prediction
Indicators & Data API
‍
Proprietary Indicators & Charts
Market Data API
Strategies & Scanner
‍
50+ Trading Strategies
Smart Stock Scanner
Smart Option Scanner
Research Reports
‍
Research Solutions
Reports Library
Free Resources
Simple Backtest Calculator
Simple Seasonality Calculator
The Kelly Criterion Calculator
Sentiment Geo Map
Public Research Reports
Education
Sentiment Indicators
Technical Indicators
Pricing
Company
About
In the News
Testimonials
Client Success Stories
Contact
Log inLoginSign up
< BACK TO ALL REPORTS

Momentum Is Waning And Stocks Are Starting To Split

Jason Goepfert
2019-07-19
null

Six months of momentum

The McClellan Summation Index has now gone 6 months in positive territory.

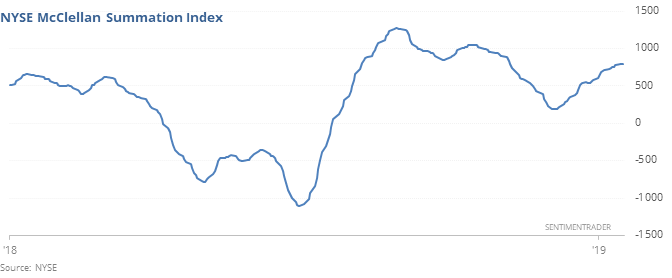
That’s a long streak compared to others since 1962. Momentum is very difficult to time, almost by definition, but by the time this measure of breadth momentum went this long above zero, forward returns for stocks were poor over the next 1-2 months, but good longer-term. Seasonality may play a part in much of that weakness – when the streak hit this length anytime from May through August, returns were even worse.

A small split

A good reason for being cautious last fall was a major split in the market. Popular indexes were hitting new highs, but under the surface there was a lot of deterioration. We’re seeing the very beginning stages of that now, especially on the Nasdaq exchange.

There haven't been any strong thrusts over the past month, and now there are more 52-week lows than 52-week highs, coming just days after the Composite was sitting at a fresh high.

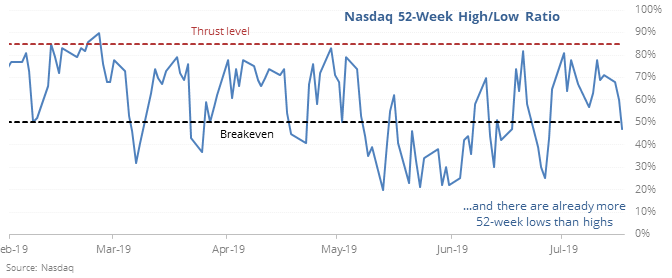
More signals in the coming week(s) would be a big caution sign.

Waning

Among all sectors and indexes we track, the McClellan Summation Index is the highest for the Dow Industrials, and its starting to roll over, having just crossed below 1,525. Per the Backtest Engine, 4 of the 6 times this triggered, the Dow traded lower over the next three months, and one of those gains was minor.

Oops

A Hindenburg Omen triggered for both the NYSE and Nasdaq on Thursday. A single reading isn’t enough to be worrisome, but these are the first since October 2018. According to the Backtest Engine, there have been 200 days since 1962 that triggered an NYSE Omen and a month later the S&P 500 was higher only 29% of the time.

This post was an abridged version of our previous day's Daily Report. For full access, sign up for a 30-day free trial now.

PRODUCTS
SentimenTrader
Trading Tools
Indicators & Data API
‍
Strategies & Scanner
‍
Research Reports
FREE
RESOUrCES
Simple Backtest
Calculator
Simple Seasonality
Calculator
The Kelly Criterion
Calculator
Sentiment Geo Map
‍
Public Research Reports
‍
Education
Sentiment Indicators
‍
Technical Indicators
‍
Pricing
Bundle pricing
‍
FAQ
‍
Announcements
‍
COMPANY
‍
About
‍
In the News
‍
Testimonials
‍
Client Success Stories
CONTACT
‍
General Inquiries
‍
Media Inquiries
‍
Financial Professionals Inquiries
‍
© 2026 Sundial Capital Research Inc. All rights reserved.
Setsail Marketing
TermsPrivacyAffiliate Program
Risk Disclosure: The information and tools provided are for research and analytical purposes only and are not intended as investment advice. Market analysis involves uncertainty, and outcomes may differ from expectations. Users should conduct their own due diligence and consider their individual circumstances before making any financial decisions. Past performance is not necessarily indicative of future results.

Hypothetical Performance Disclosure: Hypothetical performance results have many inherent limitations, some of which are described below. No representation is being made that any account will or is likely to achieve profits or losses similar to those shown; in fact, there are frequently sharp differences between hypothetical performance results and the actual results subsequently achieved by any particular trading program. One of the limitations of hypothetical performance results is that they are generally prepared with the benefit of hindsight. In addition, hypothetical trading does not involve financial risk, and no hypothetical trading record can completely account for the impact of financial risk of actual trading. for example, the ability to withstand losses or to adhere to a particular trading program in spite of trading losses are material points which can also adversely affect actual trading results. There are numerous other factors related to the markets in general or to the implementation of any specific trading program which cannot be fully accounted for in the preparation of hypothetical performance results and all which can adversely affect trading results.

Testimonial Disclosure: Testimonials appearing on this website may not be representative of other clients or customers and is not a guarantee of future performance or success.