Products
SentimenTrader Trading Tools
‍
Backtest Engine
My Trading Toolkit
Correlation Analysis
Seasonality
Market Prediction
Indicators & Data API
‍
Proprietary Indicators & Charts
Market Data API
Strategies & Scanner
‍
50+ Trading Strategies
Smart Stock Scanner
Smart Option Scanner
Research Reports
‍
Research Solutions
Reports Library
Free Resources
Simple Backtest Calculator
Simple Seasonality Calculator
The Kelly Criterion Calculator
Sentiment Geo Map
Public Research Reports
Education
Sentiment Indicators
Technical Indicators
Pricing
Company
About
In the News
Testimonials
Client Success Stories
Contact
Log inLoginSign up
< BACK TO ALL REPORTS

Momentum is building in Brazil

Dean Christians
2022-10-05
The Ibovespa index closed at a 30-day high with the most substantial price momentum since the Pandemic bottom. The momentum breakout triggered a buy signal with favorable returns, win rates, and z-scores across all time frames.

Key points:

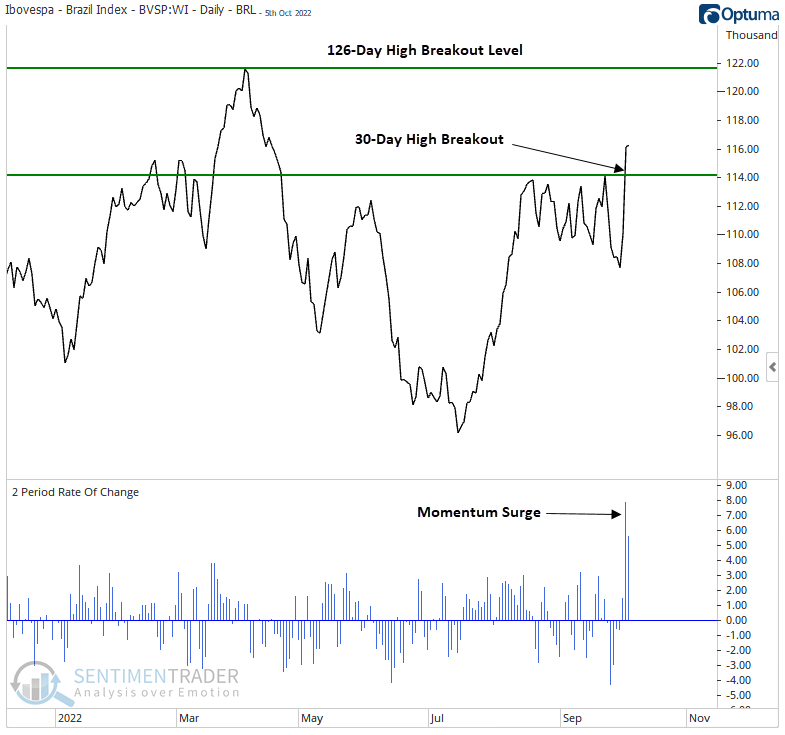
  • The Brazil Ibovespa index surged more than 7% over the past two sessions
  • At the same time, the index closed at a 30-day high but not a 126-day high
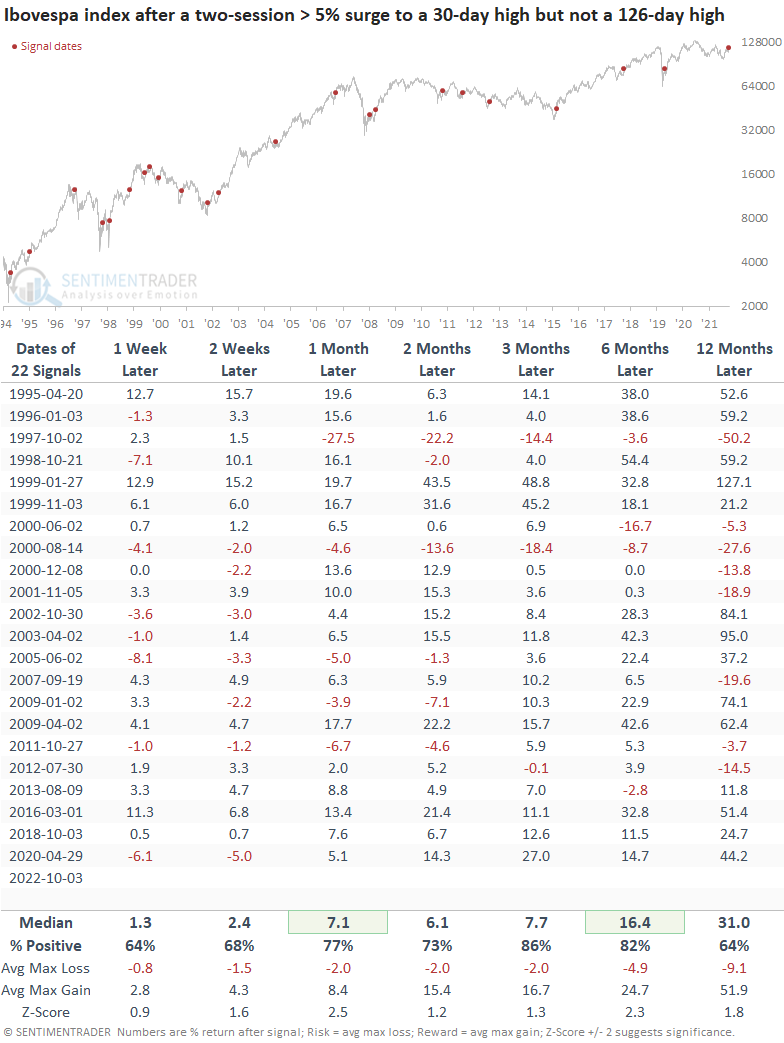
  • After similar momentum breakouts, the Ibovespa was higher a month later 77% of the time

Should we buy the momentum breakout in Brazil?

Brazil is a market I'm keeping an eye on for trade ideas as the central bank stayed put at its most recent policy meeting in September. While they could undoubtedly press the hike button again, a further pause or even pivot to an easing cycle would be a welcome development.

On Monday, the Brazilian Ibovespa index surged over 7% in two sessions and closed at a 30-day high but not a 126-day. The momentum breakout triggered a buy signal for Brazilian stocks.

Momentum breakout signals preceded positive returns for the Ibovespa index

The Ibovespa index performed well after momentum breakouts, especially a month later. The signal shows a positive return in all but two instances at some point in the first month. 

The 126-day high condition is a critical part of the breakout model as it ensures that the system buys with the index below a medium-term resistance level. For that reason, the 3 & 6-month time frames show excellent results. U.S. dollar-based traders can use the iShares ETF (EWZ) as a proxy for the Ibovespa index.

It's all about central bank policy

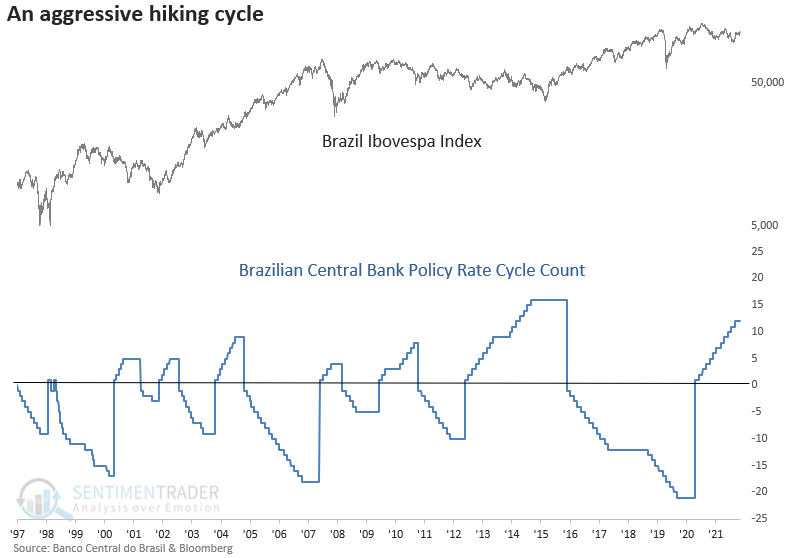
The Brazilian central bank has been on an aggressive tightening cycle, hiking the target rate 12 times since March 2021. However, at the September meeting, the central bank paused. Since the meeting, the Ibovespa index is up 3.84% versus a flat return for the S&P 500.

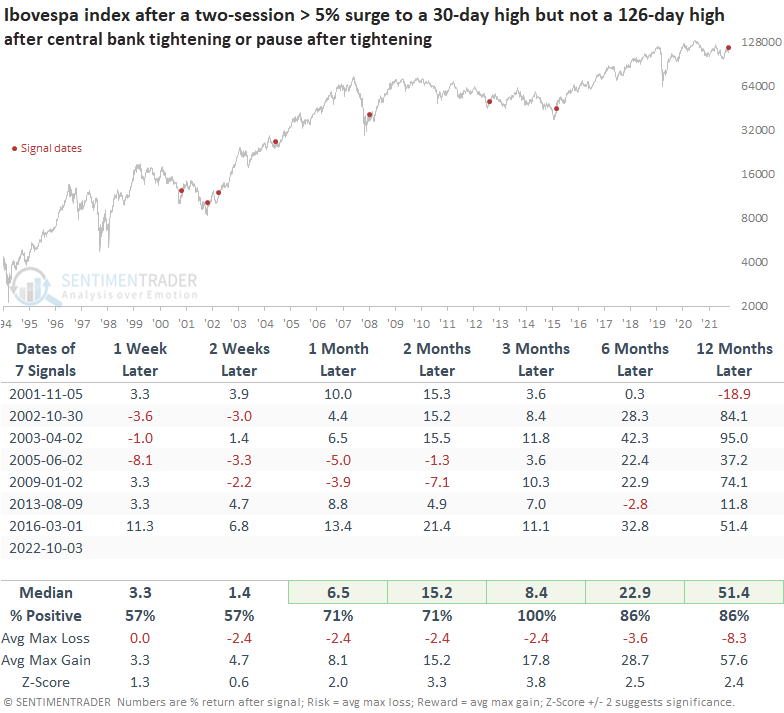
Suppose I isolate the momentum breakout signals based on when the Brazil central bank was either tightening or had paused after a tightening cycle. In that case, the model performed well across all time frames, especially three months later. 

What the research tells us...

The Brazilian Ibovespa index surged to a 30-day high but not a 126-day high, triggering a momentum breakout signal. After similar momentum breakout alerts, the Ibovespa index showed favorable returns, win rates, and z-scores across several time frames. The results were excellent if a signal occurred in a tightening cycle or after a hiking cycle pause. The pivot matters.

PRODUCTS
SentimenTrader
Trading Tools
Indicators & Data API
‍
Strategies & Scanner
‍
Research Reports
FREE
RESOUrCES
Simple Backtest
Calculator
Simple Seasonality
Calculator
The Kelly Criterion
Calculator
Sentiment Geo Map
‍
Public Research Reports
‍
Education
Sentiment Indicators
‍
Technical Indicators
‍
Pricing
Bundle pricing
‍
FAQ
‍
Announcements
‍
COMPANY
‍
About
‍
In the News
‍
Testimonials
‍
Client Success Stories
CONTACT
‍
General Inquiries
‍
Media Inquiries
‍
Financial Professionals Inquiries
‍
© 2026 Sundial Capital Research Inc. All rights reserved.
Setsail Marketing
TermsPrivacyAffiliate Program
Risk Disclosure: The information and tools provided are for research and analytical purposes only and are not intended as investment advice. Market analysis involves uncertainty, and outcomes may differ from expectations. Users should conduct their own due diligence and consider their individual circumstances before making any financial decisions. Past performance is not necessarily indicative of future results.

Hypothetical Performance Disclosure: Hypothetical performance results have many inherent limitations, some of which are described below. No representation is being made that any account will or is likely to achieve profits or losses similar to those shown; in fact, there are frequently sharp differences between hypothetical performance results and the actual results subsequently achieved by any particular trading program. One of the limitations of hypothetical performance results is that they are generally prepared with the benefit of hindsight. In addition, hypothetical trading does not involve financial risk, and no hypothetical trading record can completely account for the impact of financial risk of actual trading. for example, the ability to withstand losses or to adhere to a particular trading program in spite of trading losses are material points which can also adversely affect actual trading results. There are numerous other factors related to the markets in general or to the implementation of any specific trading program which cannot be fully accounted for in the preparation of hypothetical performance results and all which can adversely affect trading results.

Testimonial Disclosure: Testimonials appearing on this website may not be representative of other clients or customers and is not a guarantee of future performance or success.