
Momentum in the world's most risky asset shifted to a bull regime

Key points:
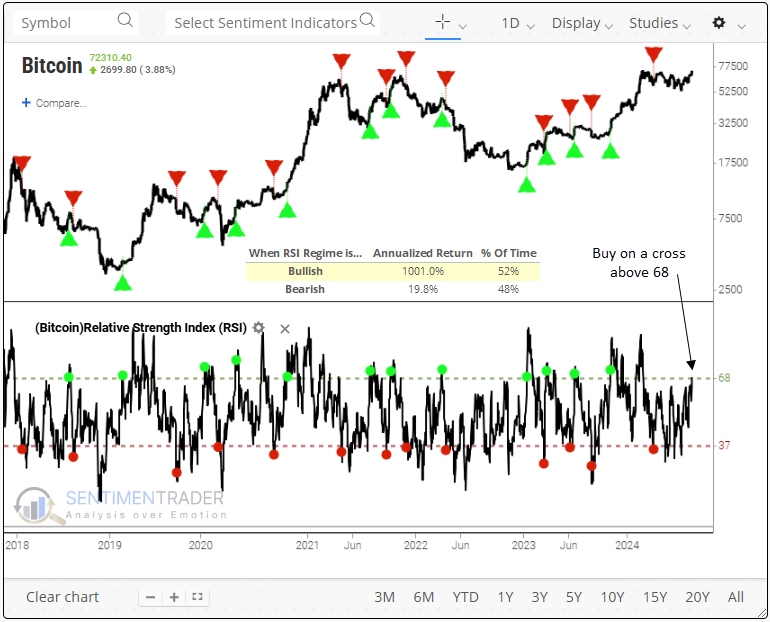
- The RSI for Bitcoin shifted to a favorable position, triggering a buy signal for the cryptocurrency
- When the RSI maintains a bull regime status, the cryptocurrency produces an annualized return of 1000%
- During Bitcoin bull regimes, stocks saw robust performance, especially in growth-oriented sectors
The weight of the evidence is piling up on the bullish side of the ledger for Bitcoin
Bitcoin's high volatility makes it an ideal candidate for momentum trading. The digital currency frequently experiences significant price swings that present numerous trading opportunities. With Bitcoin's rapid shifts, traders can leverage momentum strategies to capture upward and downward moves.
The Relative Strength Index (RSI) is particularly well-suited for detecting these momentum shifts, as it measures the speed and degree of price movements.
A simple trading system that uses the Relative Strength Index (RSI) to identify bullish or bearish momentum regimes triggered a buy signal for Bitcoin when the RSI rose above 68. This bullish status will persist until the RSI dips below 37, at this point, the model shifts back to a bear regime.
The previous bull regime signal occurred in October 2023, leading to a 93% gain before the model shifted back to a bear regime in May 2024.
Positive price momentum tends to beget more positive price momentum
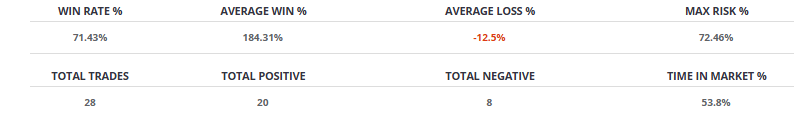
Since 2010, the RSI system has generated 28 bull regime signals with a 71% success rate, achieving an average gain of 184% per win, while losses averaged -12.5%.
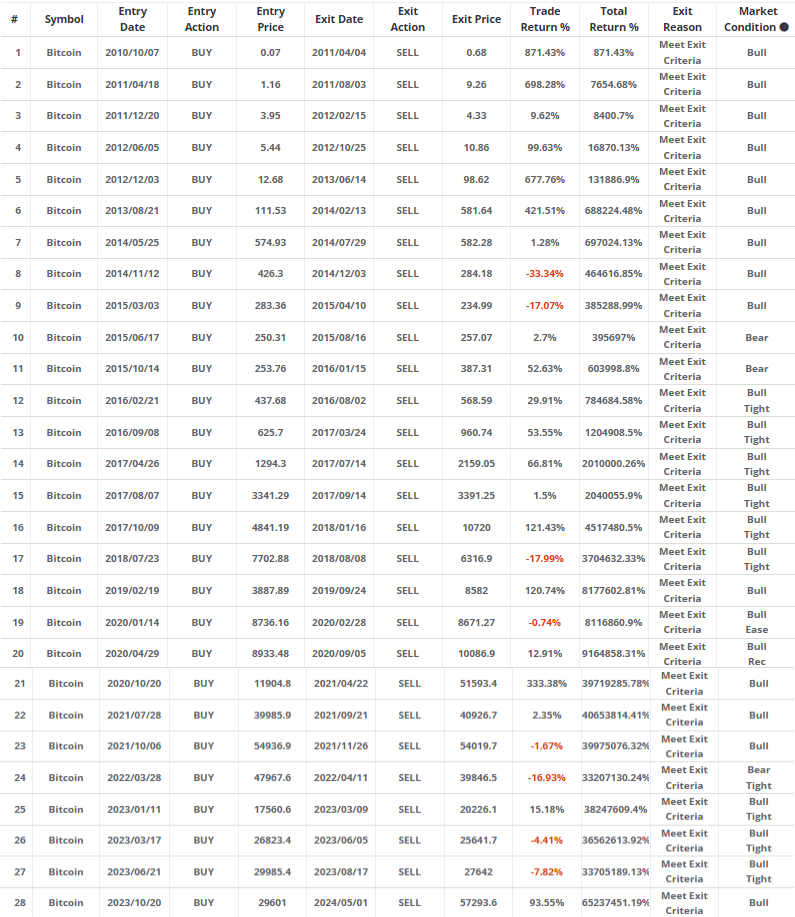
The following table provides each signal's entry and exit dates and the resulting profit or loss. The highest recorded loss was -33% in 2014. It's also worth noting that, except for the October 2020 signal, recent gains have been considerably lower than those observed in Bitcoin's early years. Traders would be wise to adjust their expectations accordingly.
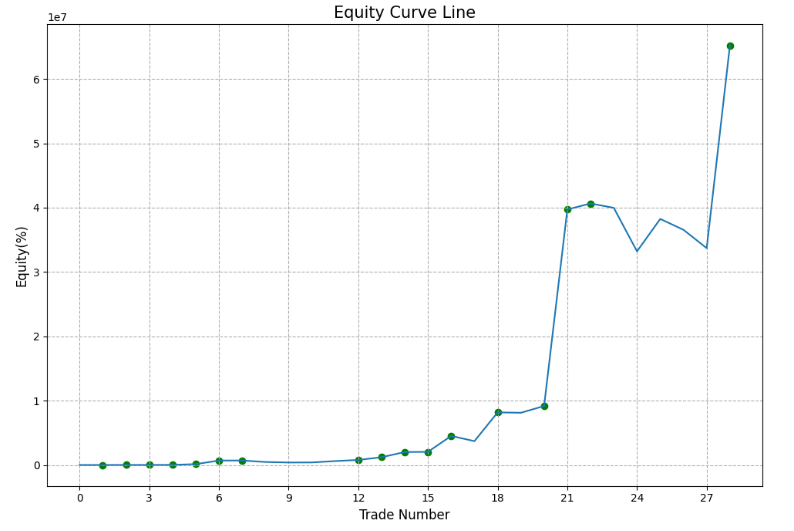
An equity curve visually represents how a system's signal has performed over time, helping to evaluate the model's effectiveness. As a guiding principle, it should progress steadily from the lower left to the upper right, which the Bitcoin RSI system has generally accomplished.
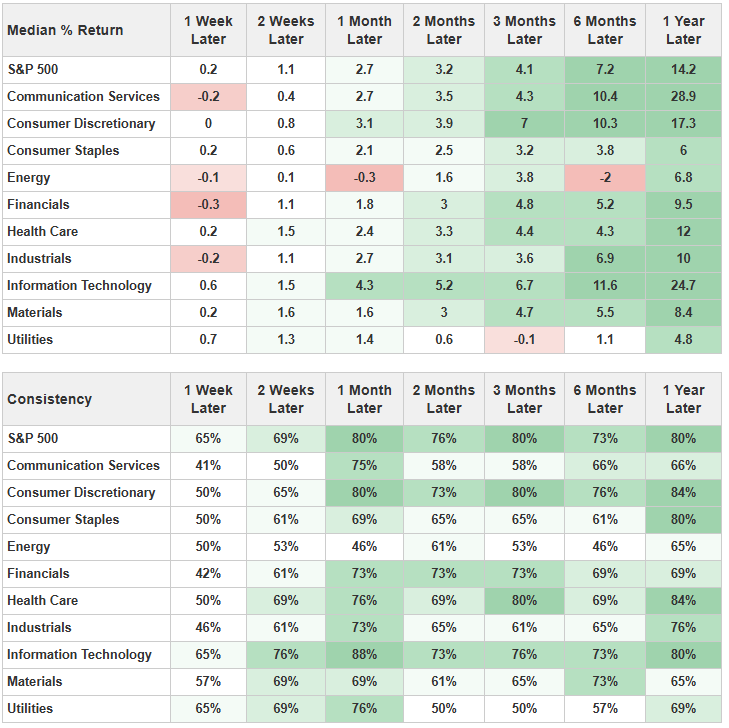
When Bitcoin experienced favorable momentum, it was also advantageous for stocks
From one to twelve months later, consistency and returns for the S&P 500 and growth-oriented sectors were robust. That was especially the case for technology in the near term, registering an 88% win rate one month later.
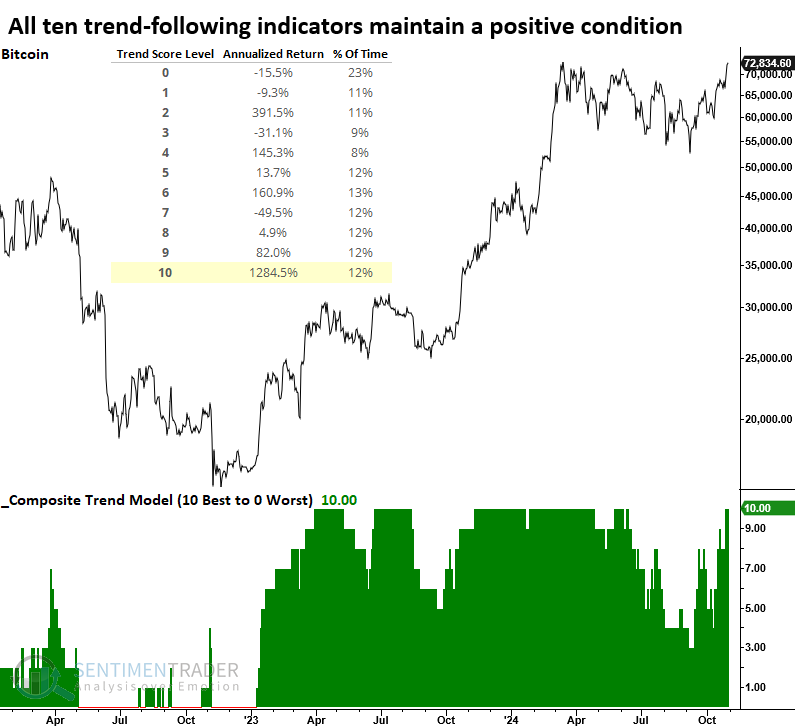
Additional evidence that favors the bullish case for Bitcoin
The composite trend model for Bitcoin has returned to a score of ten, indicating that all components maintain a positive status. Trend score readings of ten have yielded the highest annualized returns for digital currency, achieving a remarkable 1284% gain.
Stay tuned! We'll soon be rolling out the trend score indicators to additional assets, including Bitcoin, on the website.
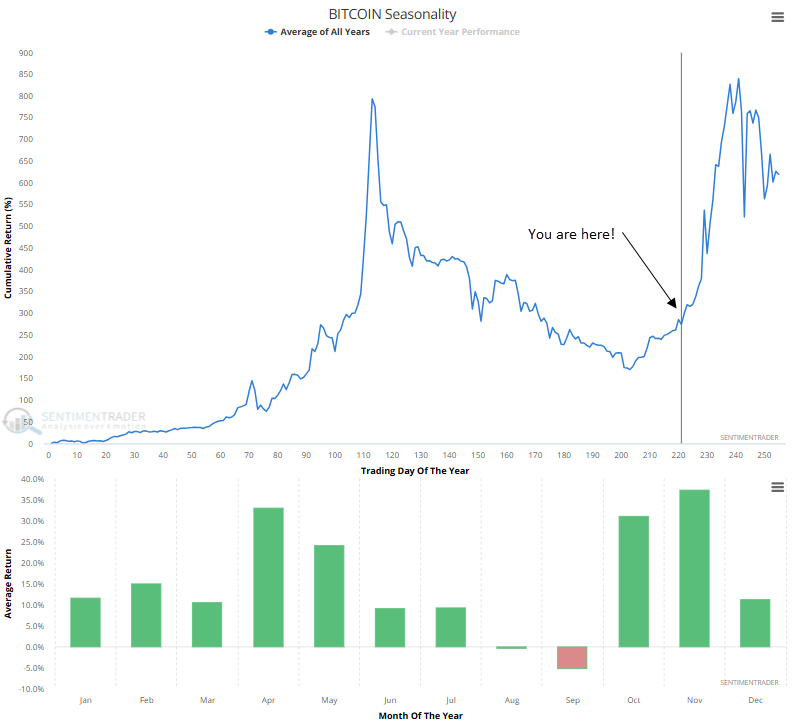
A favorable seasonal period
Like stocks, Bitcoin is about to enter a seasonally advantageous period. Furthermore, November historically shows the highest average returns of any month.
Backtest Engine
Click here to add the RSI system for Bitcoin to your favorites folder in the Backtest Engine 2.0.
What the research tells us...
Bitcoin has been consolidating in a reasonably tight range since March 2024. However, more and more evidence suggests that the cryptocurrency could be on the cusp of a significant breakout. One such measure is a price momentum system that uses the Relative Strength Index (RSI) to identify bullish or bearish market regimes. That system and several other indicators like trend and seasonality indicate that the weight of the evidence favors the bulls. The only concern is that the setup looks too perfect. Therefore, expect the unexpected, which could entail some volatility that shakes out the weak hands. As with any volatile asset, Bitcoin demands a disciplined approach to risk management.