Products
SentimenTrader Trading Tools
‍
Backtest Engine
My Trading Toolkit
Correlation Analysis
Seasonality
Market Prediction
Indicators & Data API
‍
Proprietary Indicators & Charts
Market Data API
Strategies & Scanner
‍
50+ Trading Strategies
Smart Stock Scanner
Smart Option Scanner
Research Reports
‍
Research Solutions
Reports Library
Free Resources
Simple Backtest Calculator
Simple Seasonality Calculator
The Kelly Criterion Calculator
Sentiment Geo Map
Public Research Reports
Education
Sentiment Indicators
Technical Indicators
Pricing
Company
About
In the News
Testimonials
Client Success Stories
Contact
Log inLoginSign up
< BACK TO ALL REPORTS

Momentum in the 10-year Treasury suggests higher rates

Dean Christians
2023-10-04
The momentum in the 10-year bond yield continues, with the Relative Strength Index (RSI) surging above a reading of 77. After similar signals, the long-term bond yield tended to rise further in the near term. Stocks show stagnant results, and one needs to keep an eye on financials, especially banks.

Key points:

  • The Relative Strength Index (RSI) for the 10-year yield crossed above 77
  • Similar momentum signals suggest the long-term bond yield can rise further
  • The S&P 500 shows stagnant returns, and financials could struggle

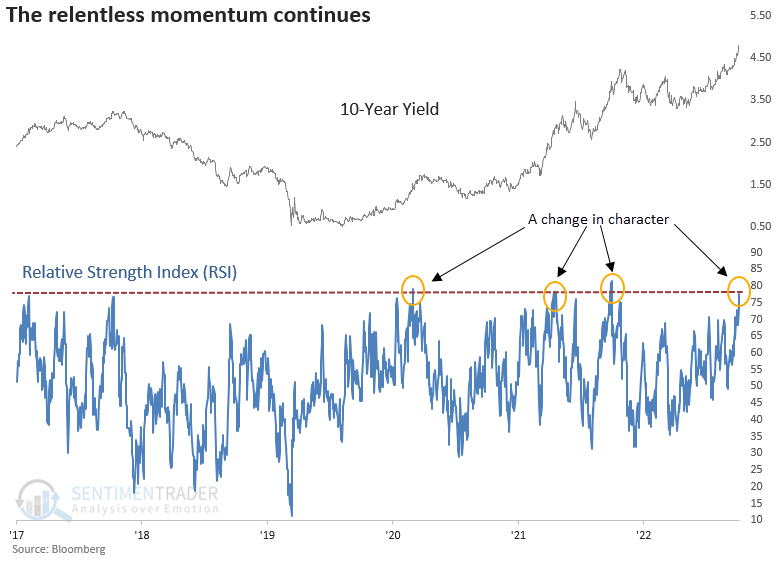
A significant change in character for a vitally important bond yield

The Relative Strength Index (RSI) for the 10-year yield crossed above 77, indicating positive momentum for a critical long-term interest rate benchmark. What makes the overbought condition significant? It's worth mentioning because, during the secular downtrend in yields from 1981 to 2020, the RSI never crossed above 77 more than two times in any countertrend rally in the 10-year, let alone four times like now.

This change in character provides additional evidence suggesting the secular downtrend in yields has reversed to a secular uptrend. 

Similar momentum-based signals led to higher rates

When the RSI exceeds 77, the upward trajectory in the 10-year yield will likely continue in the near term. In 52 out of 60 prior instances, the benchmark yield was higher at some point over the next month. Two months later, it was higher in 55 out of 60 cases.

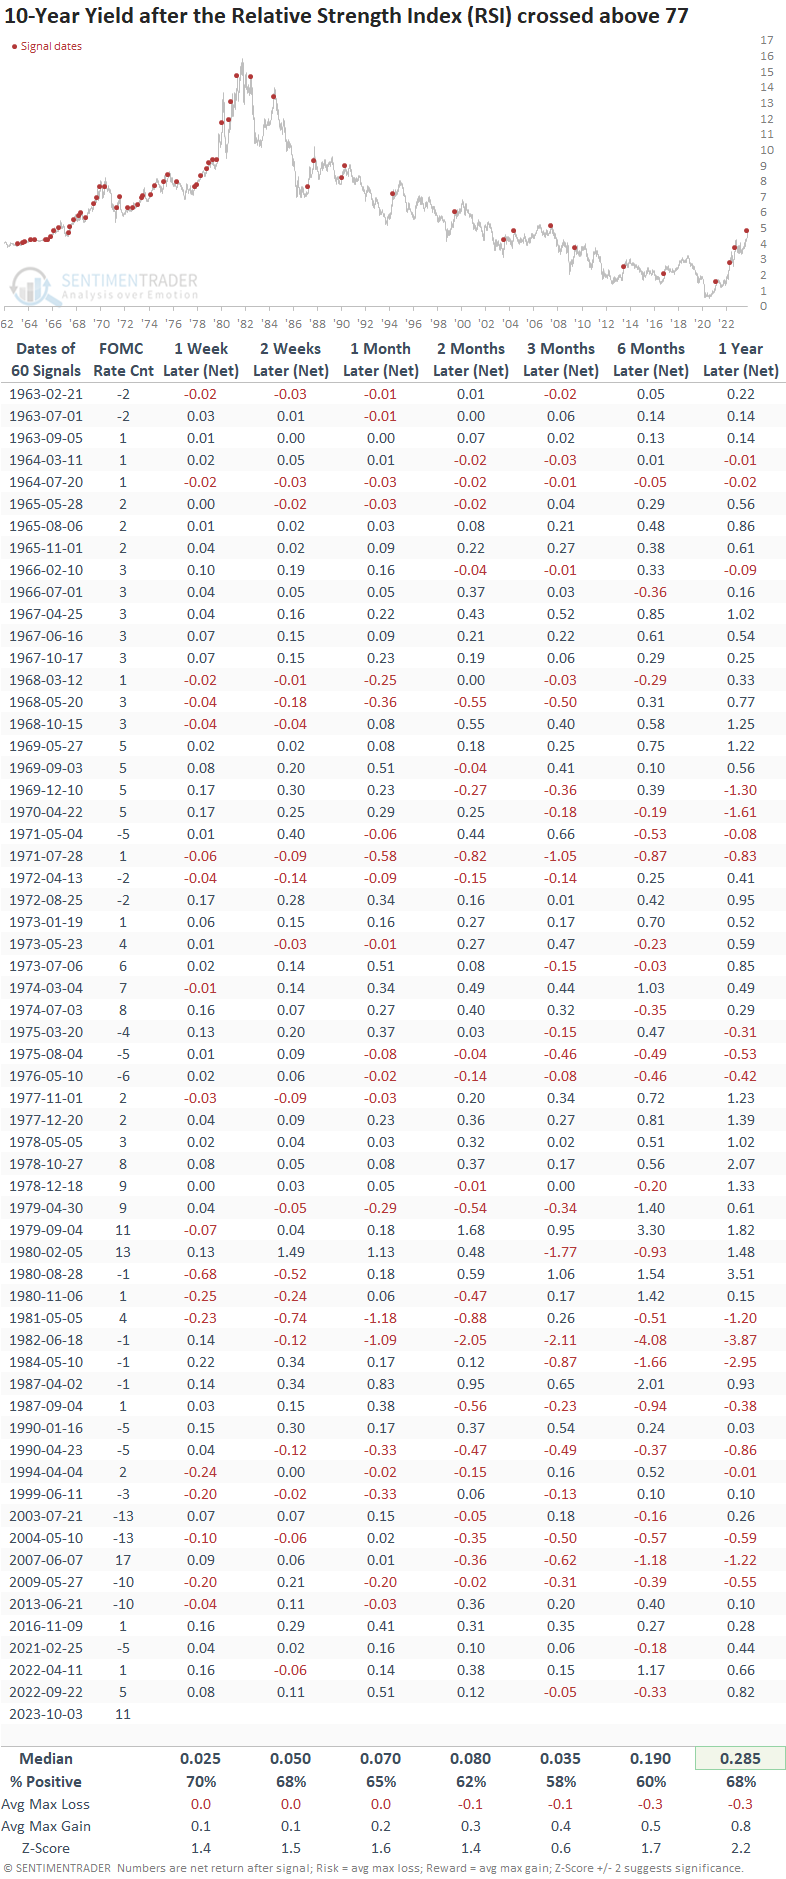
To screen out repeats, I required the RSI to fall below 50 before a new signal could trigger again. 

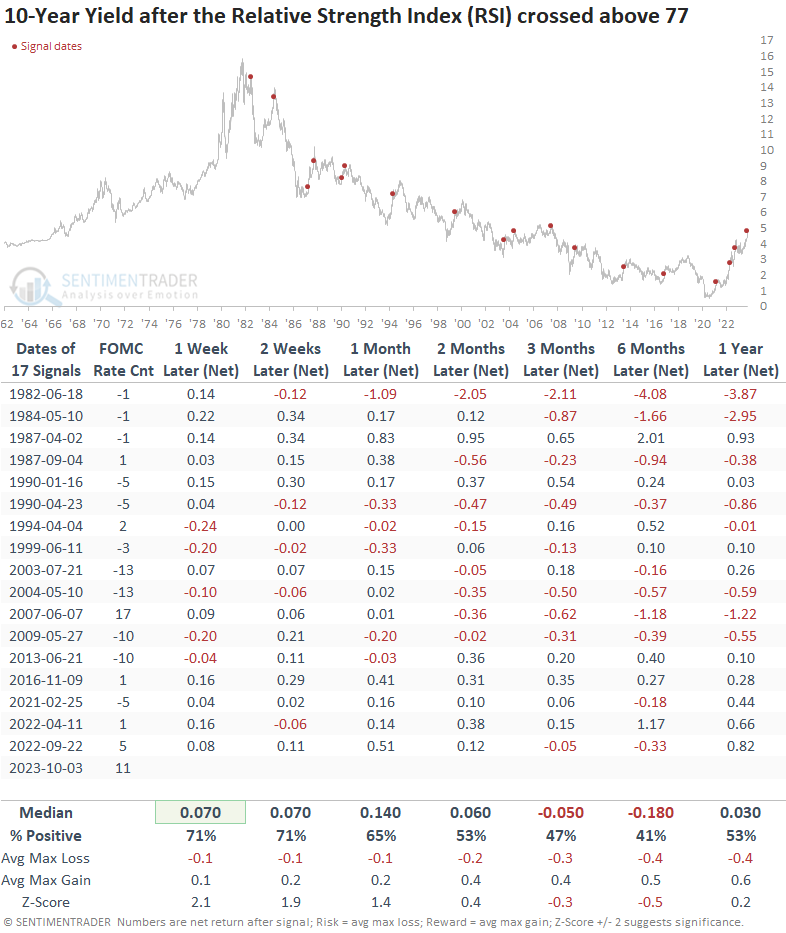
Signals since the peak in yields in 1981

Even during the secular downtrend in Treasury yields, the 10-year yield tended to increase in the short term after similar RSI readings. Over the next month, the benchmark yield experienced an increase in 16 out of 17 previous occurrences.

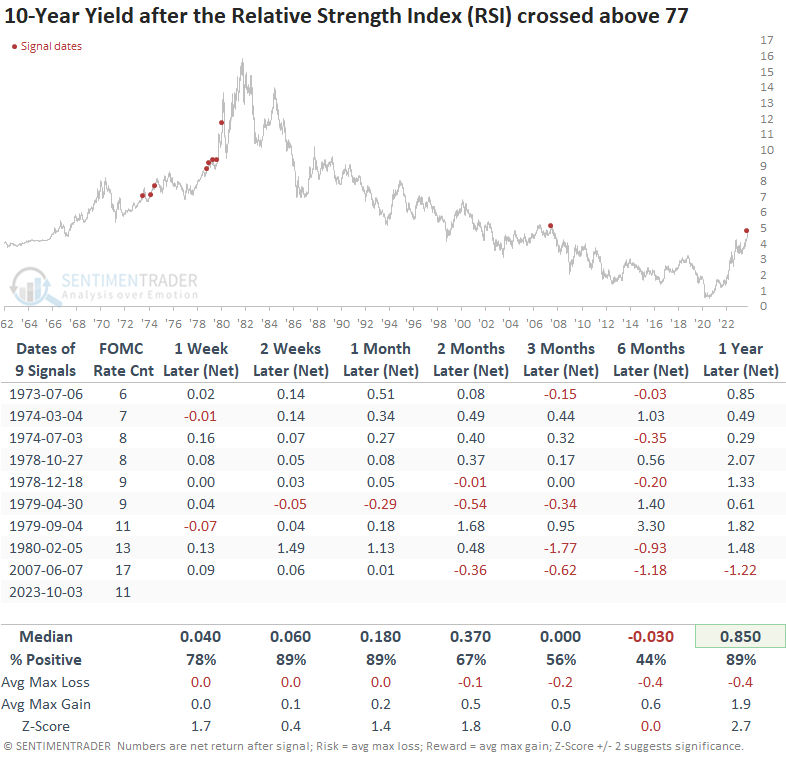
Signals after more than five FOMC interest rate hikes

Let's isolate RSI signals during Federal Reserve tightening cycles. When the FOMC rate hike count is five or more, there is a stronger tendency for the 10-year yield to experience further upside. In every case, over the subsequent month, the benchmark yield was higher at some point.

What about stocks?

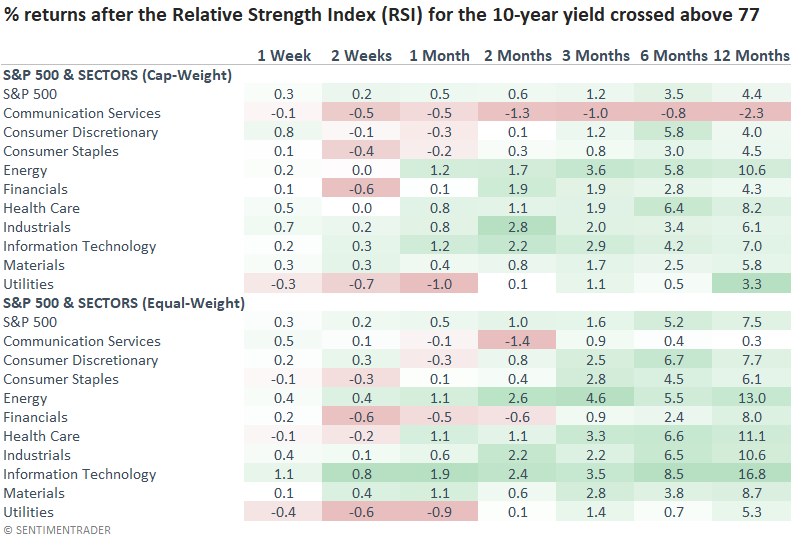
The world's most benchmarked index and its associated sectors display rather lackluster performance in the coming months, and even the outlook for the next year doesn't offer a compelling case. Not surprisingly, the Utility sector, which I noted is extremely oversold, struggles when rates rise.

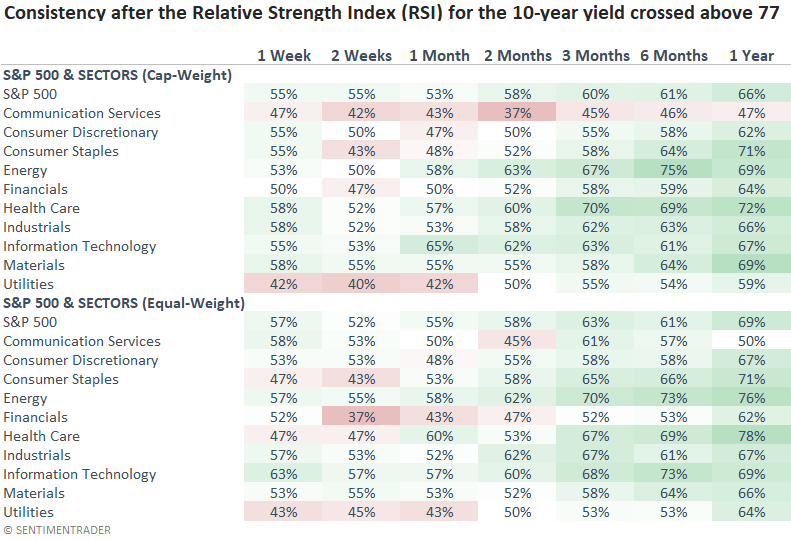
Like the returns table, consistency fails to impress over the next few months.

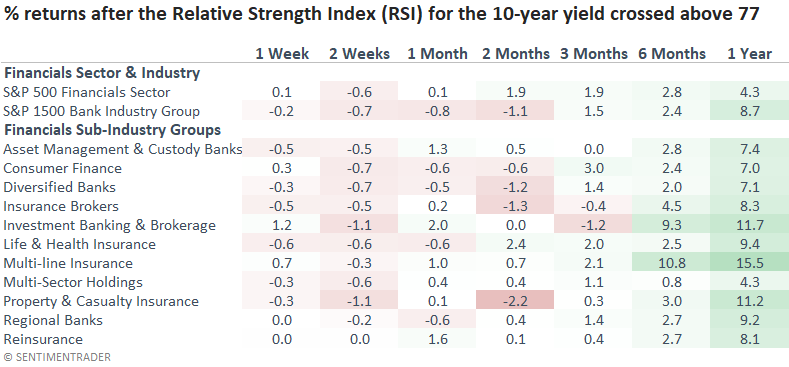
A systemically important industry

Most sub-industries within the financials sector struggle in a rising rate environment like now. Banks, in particular, are a critical group to monitor for signs of credit market stress. For what's its worth, Bank of America and Citigroup are hitting two-and-a-half-year lows.  

My colleague, Jason Goepfert, published a research note on the 10-year yield. While the outlook for bonds differed, the studies both suggested weak stock results in the near term. 

What the research tells us...

The upward trajectory in the 10-year yield continues with the Relative Strength Index (RSI), a momentum indicator, exceeding a reading of 77 for the 4th time since 2020, suggesting that interest rates are in a markedly different environment than the secular downtrend from 1981 to 2020. Similar momentum-based signals tend to lead to a further rate rise, especially over the next month. Under this scenario, one should expect lackluster returns from stocks. Finally, I would watch the banking industry for signs of credit market stress.

PRODUCTS
SentimenTrader
Trading Tools
Indicators & Data API
‍
Strategies & Scanner
‍
Research Reports
FREE
RESOUrCES
Simple Backtest
Calculator
Simple Seasonality
Calculator
The Kelly Criterion
Calculator
Sentiment Geo Map
‍
Public Research Reports
‍
Education
Sentiment Indicators
‍
Technical Indicators
‍
Pricing
Bundle pricing
‍
FAQ
‍
Announcements
‍
COMPANY
‍
About
‍
In the News
‍
Testimonials
‍
Client Success Stories
CONTACT
‍
General Inquiries
‍
Media Inquiries
‍
Financial Professionals Inquiries
‍
© 2026 Sundial Capital Research Inc. All rights reserved.
Setsail Marketing
TermsPrivacyAffiliate Program
Risk Disclosure: The information and tools provided are for research and analytical purposes only and are not intended as investment advice. Market analysis involves uncertainty, and outcomes may differ from expectations. Users should conduct their own due diligence and consider their individual circumstances before making any financial decisions. Past performance is not necessarily indicative of future results.

Hypothetical Performance Disclosure: Hypothetical performance results have many inherent limitations, some of which are described below. No representation is being made that any account will or is likely to achieve profits or losses similar to those shown; in fact, there are frequently sharp differences between hypothetical performance results and the actual results subsequently achieved by any particular trading program. One of the limitations of hypothetical performance results is that they are generally prepared with the benefit of hindsight. In addition, hypothetical trading does not involve financial risk, and no hypothetical trading record can completely account for the impact of financial risk of actual trading. for example, the ability to withstand losses or to adhere to a particular trading program in spite of trading losses are material points which can also adversely affect actual trading results. There are numerous other factors related to the markets in general or to the implementation of any specific trading program which cannot be fully accounted for in the preparation of hypothetical performance results and all which can adversely affect trading results.

Testimonial Disclosure: Testimonials appearing on this website may not be representative of other clients or customers and is not a guarantee of future performance or success.