Data &
Technology
Research
Reports
Report Solutions
Reports Library
Actionable
Strategies
Free
Resources
Simple Backtest Calculator
Simple Seasonality Calculator
The Kelly Criterion Calculator
Sentiment Geo Map
Public Research Reports
Free Webinar
Pricing
Company
About
Meet Our Team
In the News
Testimonials
Client Success Stories
Contact
Log inLoginSign up
< BACK TO ALL REPORTS

Mom & Pop are manic about stocks

Jason Goepfert
2020-02-13
Trading activity among retail traders has gone parabolic, due in part to zero commissions. The S&P 500 has hit 36 all-time highs in the past 4 months.

Manic

With incessantly rising stocks and commission-free trading, retail traders have become manic. We could reasonably expect trading activity to rise under conditions like this.

But it has not only risen, it went parabolic in January. On E-Trade alone, trading activity has surpassed 450,000 trades. It was even higher on TD Ameritrade.E-Trade DARTs

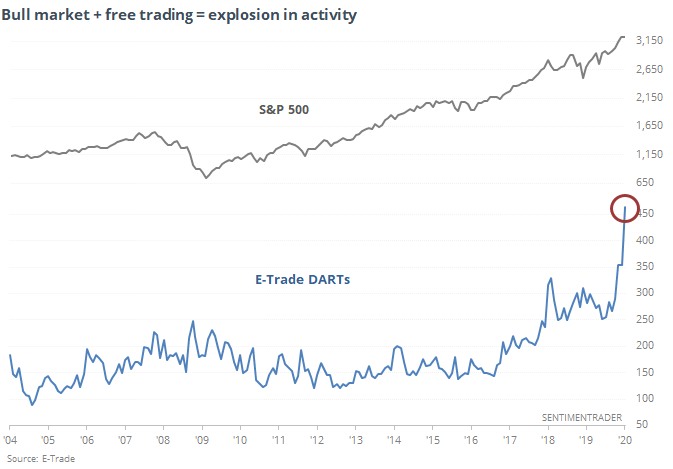
The 6-month rate of growth in trading activity at those two brokers has been matched only once before, as stocks were peaking in early 2018. Of course, this is partly driven by commission-free trading. That doesn’t completely detract from the idea that mom and pop wouldn’t have an interest in trading so much if they didn’t think they could profit.


Trading with MACD

The MACD (Moving Average Convergence Divergence) is a very popular technical indicator. We've posted an overview video in recent weeks, and Troy has published a new one that does a deep dive on the best settings to use for various markets.

Click here to view the video - the conclusions may surprise you.

Trading with MACD


Grind higher

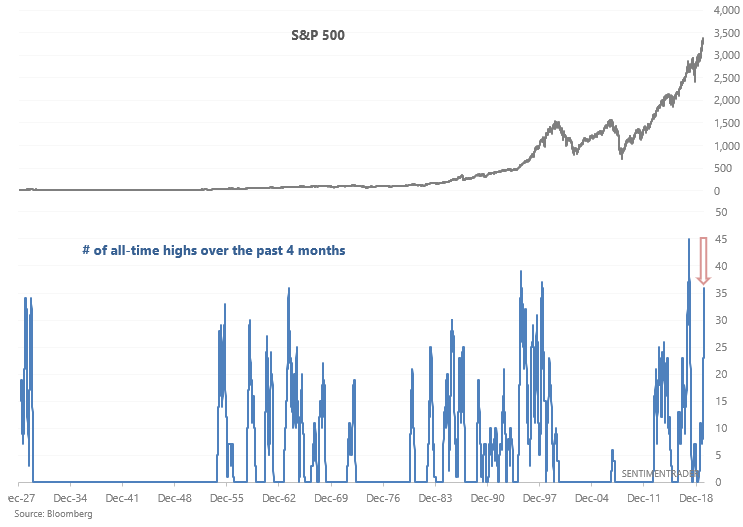
Another day, another all-time high - as they say, "never short a dull market." Through Tuesday, the S&P 500 has made 36 all-time highs over the past 4 months, a feat that has been only matched 4 other times:

S&P 500 new highs

While it's easy to assume that this is short term bearish for stocks, that hasn't usually been the case historically.

S&P 500 after many all time highs

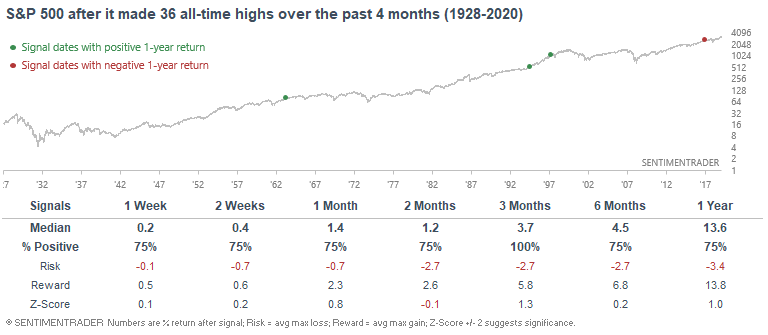
Granted, the sample size is tiny. But even when we relax the parameters to get more precedents, the overall theme remains the same. While stocks typically rose going forward, the risk/reward was about flat over the next couple of months. Many times, this kind of push led to a multi-month consolidation.

Like most momentum studies, longer-term returns were better.

This is an abridged version of our recent reports and notes. For immediate access with no obligation, sign up for a 30-day free trial now.

We also looked at:

  • SPY has been gapping up almost every morning, behavior matched only once before in nearly 30 years
  • Most stocks in the S&P 500 have been holding above their 50- and 200-day averages for 4 straight months
  • NYSE new highs have reached a 2-year extreme
  • Job openings (JOLTs) have plunged over the past 2 months
  • What happens when the VIX stays under 19 for four months
  • U.S. economic surprises just jumped to a 400-day high
DATA &
TECHnologies
IndicatorEdge
‍
BackTestEdge
‍
Other Tools
‍
DataEdge API
RESEARCH
reports
Research Solution
‍
Reports Library
‍
actionable
Strategies
Trading Strategies
‍
Smart Stock Scanner
‍
FREE
RESOUrCES
Simple Backtest
Calculator
Simple Seasonality
Calculator
The Kelly Criterion
Calculator
Sentiment Geo Map
‍
Public Research Reports
‍
Free Webinar
COMPANY
‍
About
‍
Meet our Team
‍
In the News
‍
Testimonials
‍
Client Success Stories
Pricing
Bundle pricing
‍
Announcements
‍
FAQ
© 2024 Sundial Capital Research Inc. All rights reserved.
Setsail Marketing
TermsPrivacyAffiliate Program
Risk Disclosure: Futures and forex trading contains substantial risk and is not for every investor. An investor could potentially lose all or more than the initial investment. Risk capital is money that can be lost without jeopardizing ones’ financial security or life style. Only risk capital should be used for trading and only those with sufficient risk capital should consider trading. Past performance is not necessarily indicative of future results.

Hypothetical Performance Disclosure: Hypothetical performance results have many inherent limitations, some of which are described below. No representation is being made that any account will or is likely to achieve profits or losses similar to those shown; in fact, there are frequently sharp differences between hypothetical performance results and the actual results subsequently achieved by any particular trading program. One of the limitations of hypothetical performance results is that they are generally prepared with the benefit of hindsight. In addition, hypothetical trading does not involve financial risk, and no hypothetical trading record can completely account for the impact of financial risk of actual trading. for example, the ability to withstand losses or to adhere to a particular trading program in spite of trading losses are material points which can also adversely affect actual trading results. There are numerous other factors related to the markets in general or to the implementation of any specific trading program which cannot be fully accounted for in the preparation of hypothetical performance results and all which can adversely affect trading results.

Testimonial Disclosure: Testimonials appearing on this website may not be representative of other clients or customers and is not a guarantee of future performance or success.