
Misleading Buy Signal In Options

It's somewhat difficult to find any indicators among the many we follow that are showing excessive pessimism toward stocks. On any given day lately, there have been maybe two or three.
One that has shown up for the past several days is the Call/Put Ratio from the ISE Exchange. Over the past three days, it has shown that options traders have bought to open fewer than 60 call options for every 100 put options. That ranks as the lowest amount in 15 years. Only the past couple of years have seen days with almost as few calls bought as we've seen the past few days.
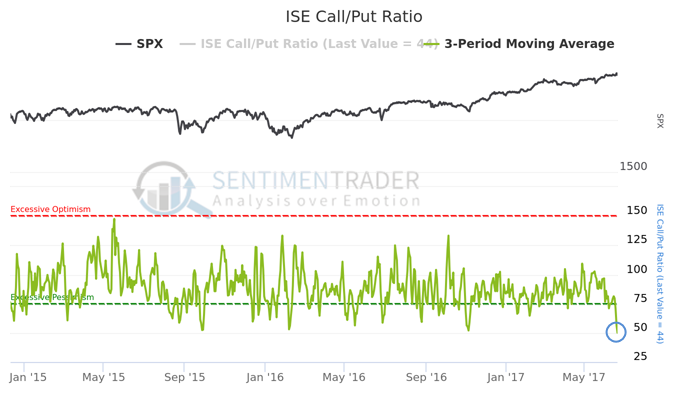
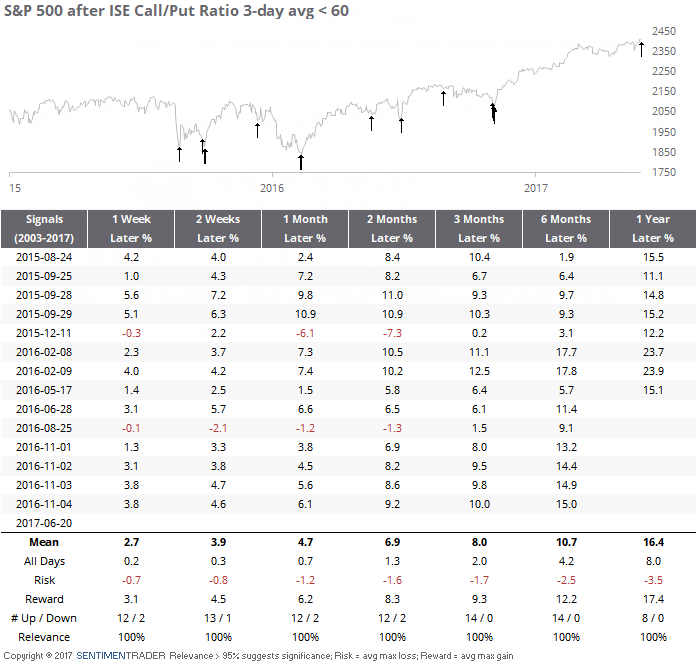
And for stocks, that has been an excellent buy signal. The S&P 500 has rallied hard after other days the 3-day average was less than 60.
But if we dig into the data, it gets messy. Now that ISE has released the data, we can see that the most active option on Tuesday was on USO, the oil fund, which saw more than twice as many puts traded as calls. So it's not exactly pessimism on equities that was driving the ratio lower.
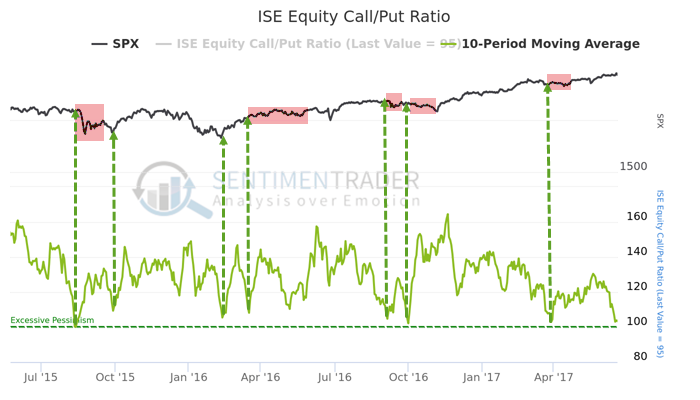
The Equity-Only Call/Put Ratio (that excludes ETF and index options) hasn't been as low as a result. Even though it hasn't been as low, it has still been drifting lower and is at a point that would suggest that even pure equity options traders are showing some pessimism.
Historically, that has been a good sign for stocks. But not lately. Something has changed with the data over the past two years, and readings of extreme pessimism in the Equity-Only ratio have not consistently led to rallies in the S&P - in fact, it led to declines more often than rallies.
It's tempting to look at the data and assume it's a big buy signal for stocks here. But "something" is going on with the data, and we wouldn't weigh it heavily at the moment.