Minutes Digest for Dec 22 2020

New highs are guaranteed
- Published:
2020-12-22 13:56:13 - Author: Jason Goepfert
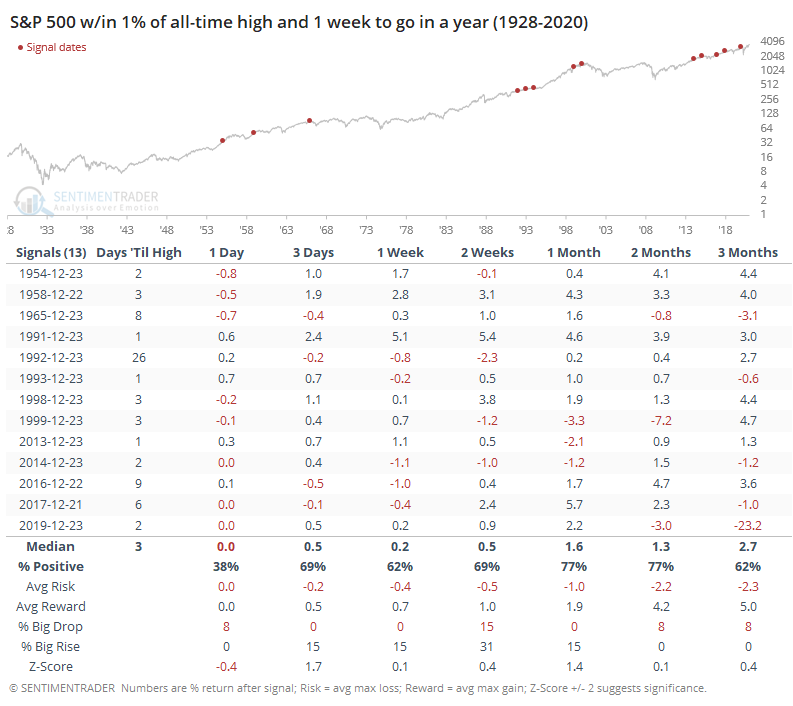
Of course, nothing is guaranteed. But stocks have had a tailwind due to the calendar for a while and will continue to for at least the next week. This won't trigger until tomorrow (maybe) but if the S&P closes within 1% of an all-time high with only a week to go until the end of the year, it has never NOT managed to ultimately close at a new high.
It took a few weeks in 1992, otherwise it usually happened before the New Year.
Energy about to become golden
- Published:
2020-12-22 09:09:42 - Author: Jason Goepfert
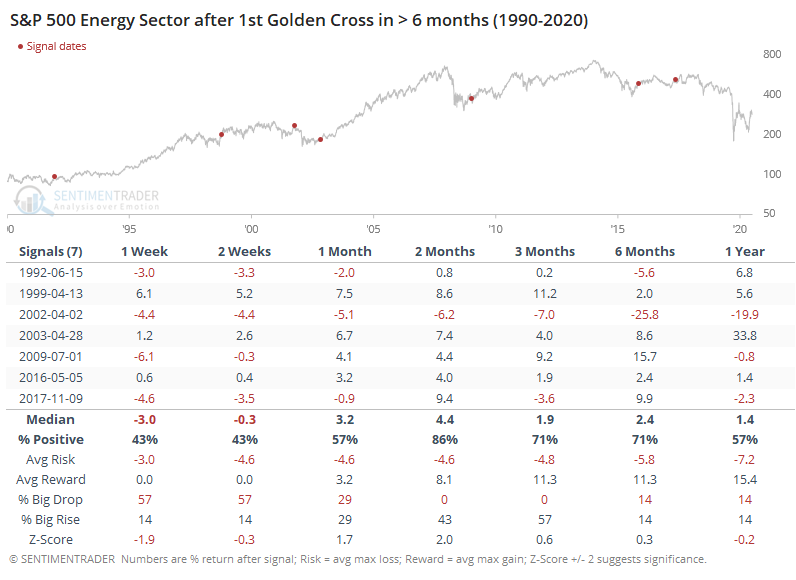
Energy names have been struggling a bit lately, trying to digest the massive moves off their recent lows. It's been enough of a push that the 50-day average is about to cross above the 200-day average in the S&P 500 Energy Sector.
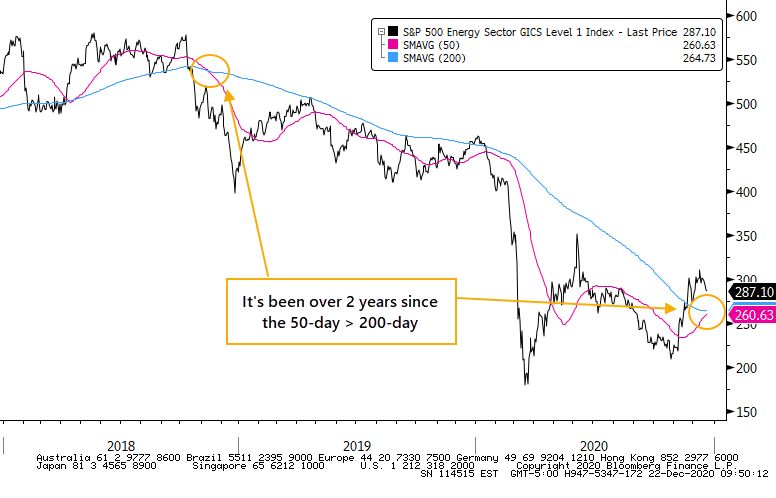
It got close before the big tumble earlier this year, but it's been over 2 years now since the 50-day managed to cross above the 200-day. That's the longest streak in 30 years. After the ends of the others, it preceded mostly good returns from 3 months and beyond, with a major loss in 2002 being about the only true failure.
Hammer time
- Published:
2020-12-22 08:21:06 - Author: Jason Goepfert
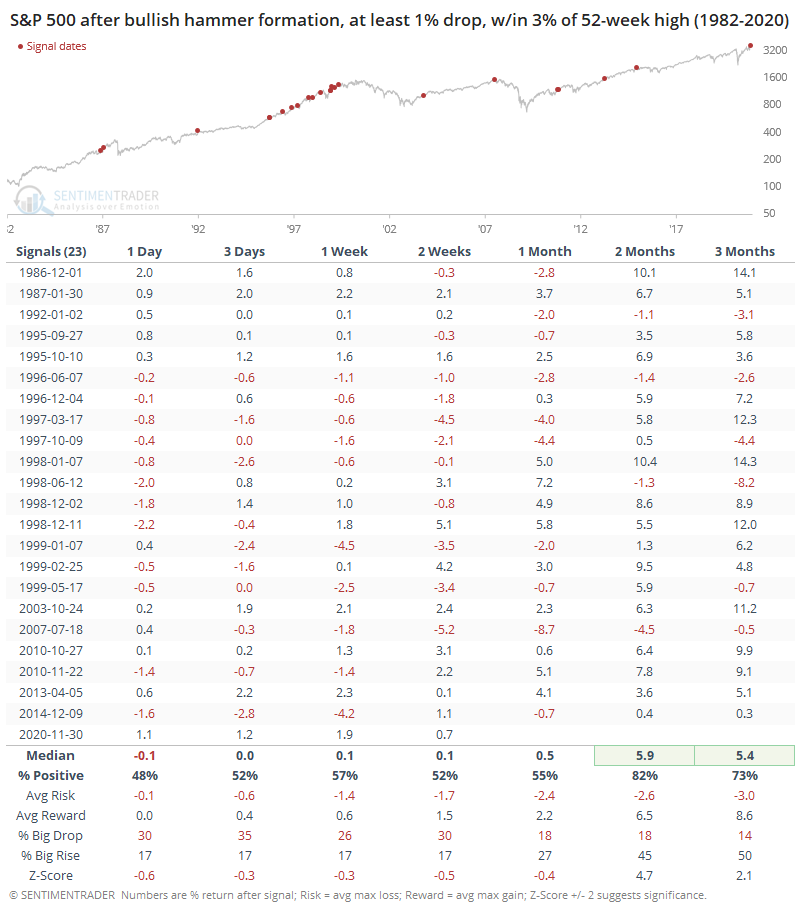
The Bloomberg algorithm suggests that the S&P 500 index carved out a hammer formation on Monday. Due to opening gaps and some weird intraday prints, most of the broad index ETFs did not.
Per Investopedia:
"A hammer is a price pattern in candlestick charting that occurs when a security trades significantly lower than its opening, but rallies within the period to close near opening price. This pattern forms a hammer-shaped candlestick, in which the lower shadow is at least twice the size of the real body. A hammer occurs after a security has been declining, suggesting the market is attempting to determine a bottom. Hammers signal a potential capitulation by sellers to form a bottom, accompanied by a price rise to indicate a potential reversal in price direction."
Intraday prints of a cash index like the S&P aren't all that reliable, especially as we go further back in history. Still, it's unusual to see one so near a high.
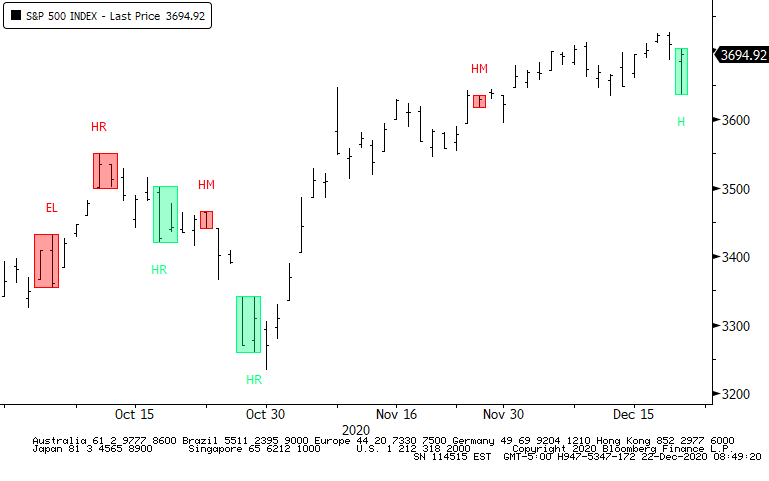
Over the past ~30 years, it has triggered a couple dozen times, when losing at least 1% intraday and closing within 3% of a 52-week high. It wasn't that great at preceding very short-term continuation, but the next 2-3 months were good. We don't put a lot of weight on one-day patterns to forecast longer-term returns, so the biggest takeaway is probably just that these supposed-to-be bullish patterns were only modestly successful at best in their expected time frame.
Index overhang
- Published:
2020-12-22 07:36:26 - Author: Jason Goepfert
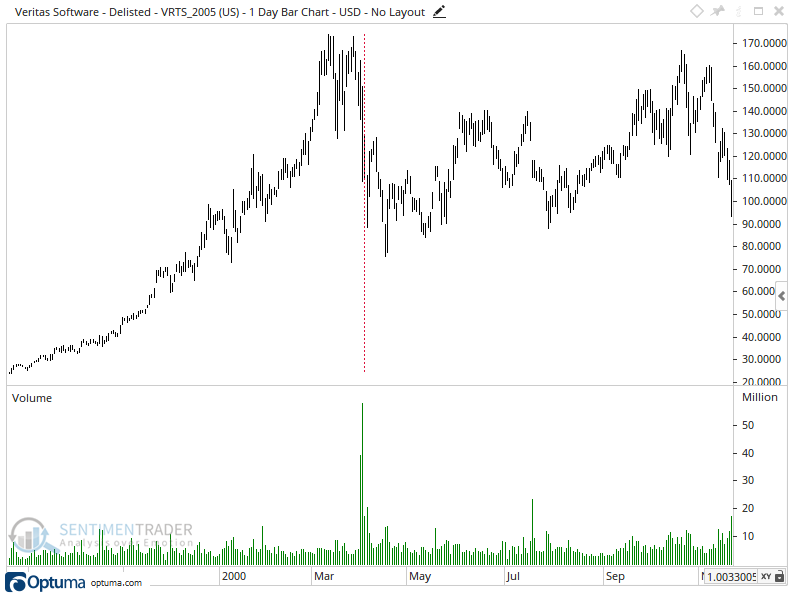
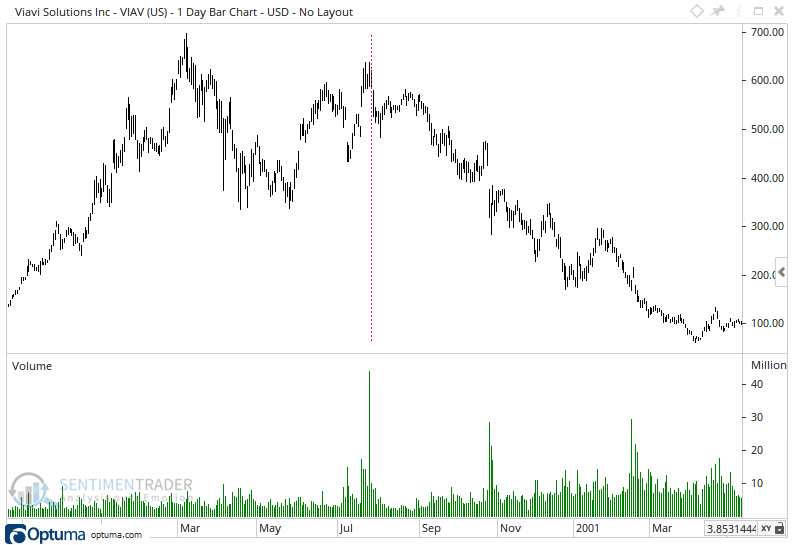
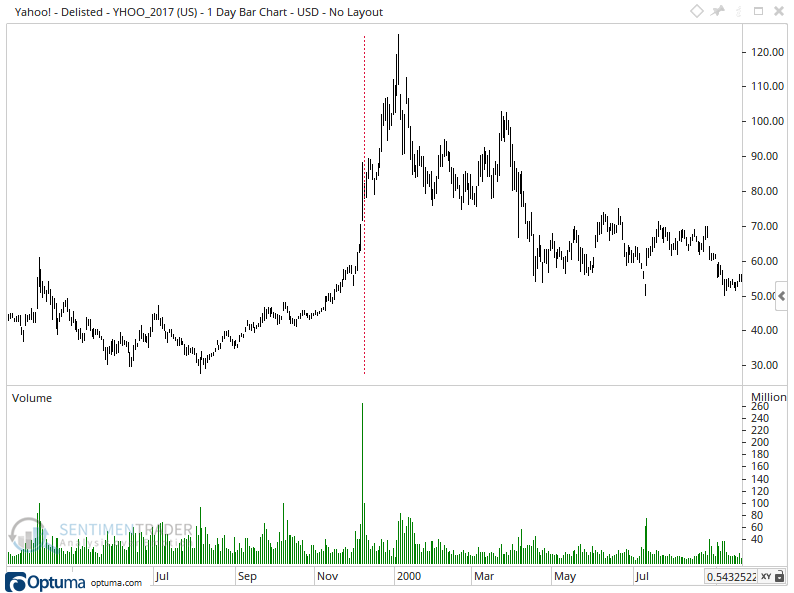
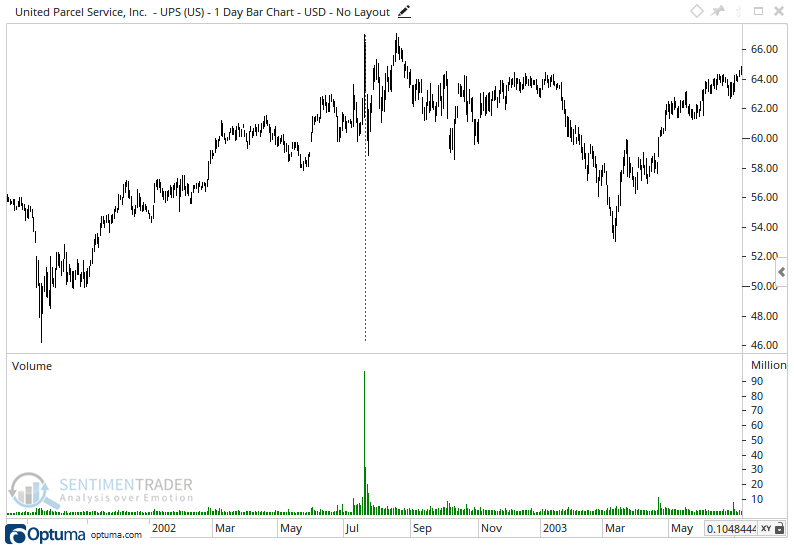
We saw in November that when the largest market cap stocks finally got added to the S&P 500 index, there was often an overhang that began immediately and lasted for months.
Even so, Tesla's first-day drops ranks among the largest of all the ones we looked at. Below, we can see the 4 others that suffered at least a 5% decline on their first day in the index. Not great company, if we're willing to read into this.