Products
SentimenTrader Trading Tools
‍
Backtest Engine
My Trading Toolkit
Correlation Analysis
Seasonality
Indicators & Data API
‍
Proprietary Indicators & Charts
Market Data API
Strategies & Scanner
‍
50+ Trading Strategies
Smart Stock Scanner
Research Reports
‍
Research Solutions
Reports Library
Free Resources
Simple Backtest Calculator
Simple Seasonality Calculator
The Kelly Criterion Calculator
Sentiment Geo Map
Public Research Reports
Pricing
Company
About
In the News
Testimonials
Client Success Stories
Contact
Log inLoginSign up
< BACK TO ALL REPORTS

Minutes Digest for Dec 09 2020

Jason Goepfert
2020-12-09
SentimenTrader Minutes Digest for Dec 09 2020 covering: NDX reversal; Big tech is bigly overbought; Nifty Nifty

NDX reversal

  • Published:
    2020-12-09 14:17:07
  • Author: Jason Goepfert

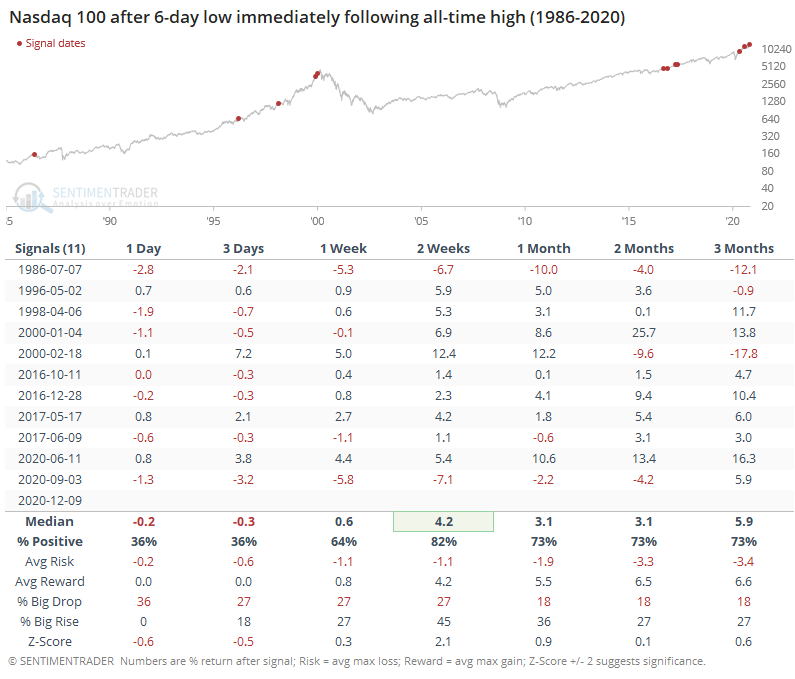
Quite a nasty reversal there in the Nasdaq 100. If it sticks into the close, then the NDX will have cycled from an all-time high to a 6-day low in one day. That's preceded some very short-term downside follow-through, then rebound over the next couple of weeks.


Big tech is bigly overbought

  • Published:
    2020-12-09 08:13:32
  • Author: Jason Goepfert

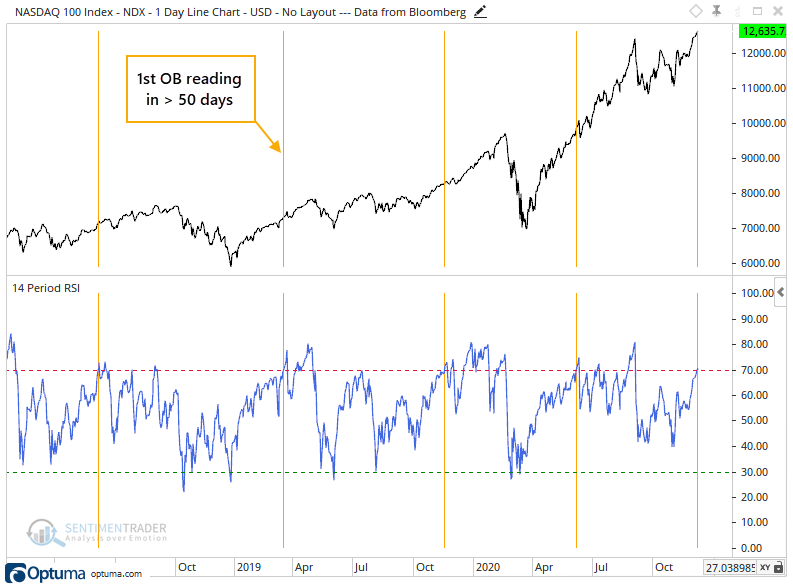
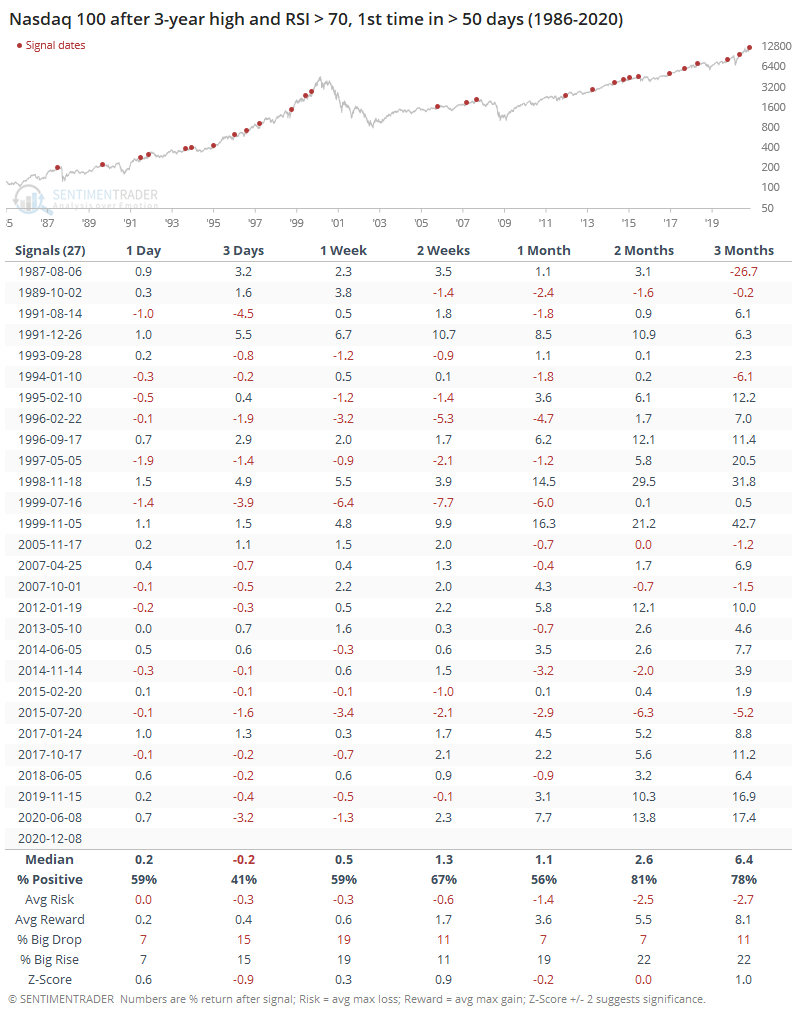
Sarah Ponczek from Bloomberg pointed out that for the first time since September, big tech has driven the Nasdaq 100 to an overbought RSI reading.

Looking at forward returns when the NDX hits overbought for the 1st time in 50 days and with a multi-year high to boot, they were mostly good. Over the next 2 months, there was only a single loss of more than -2%, which is pretty incredible given there were 27 signals. Momentum, man.

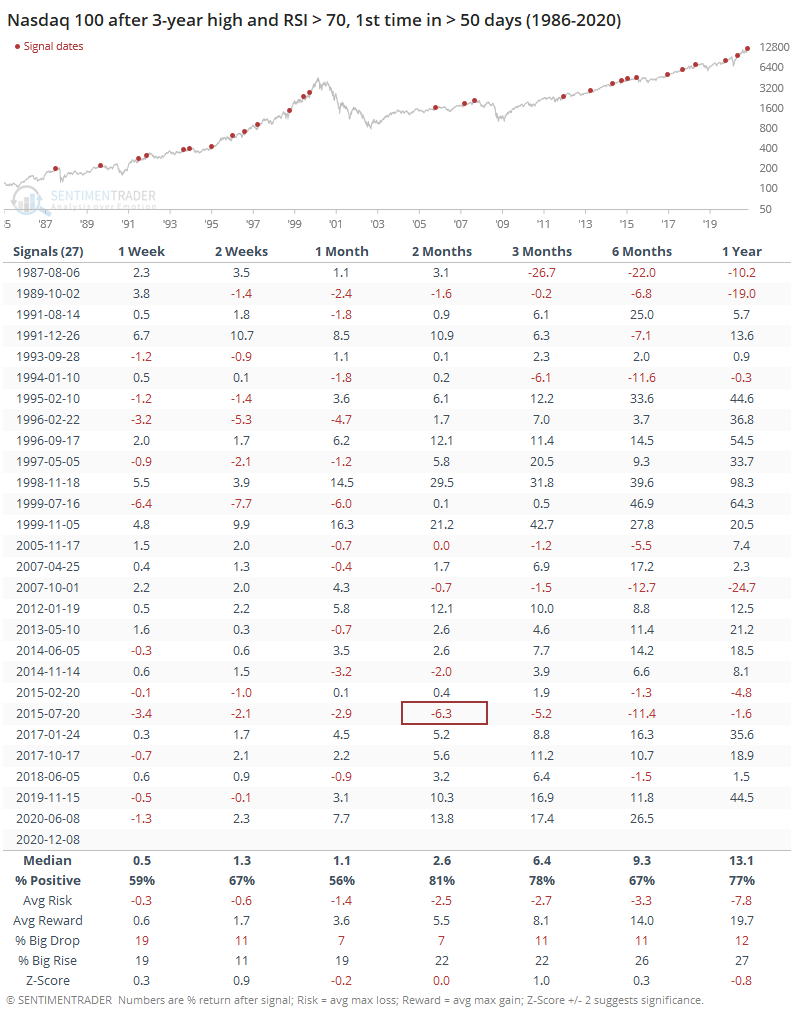
If we look at shorter-term returns, then we can see a consistent pullback over the next 3 days. That's about it.


Nifty Nifty

  • Published:
    2020-12-09 07:50:11
  • Author: Jason Goepfert

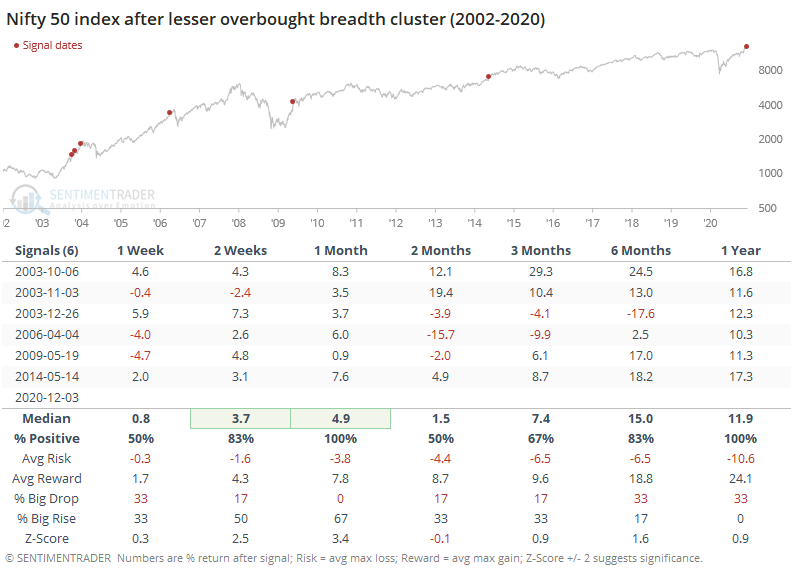
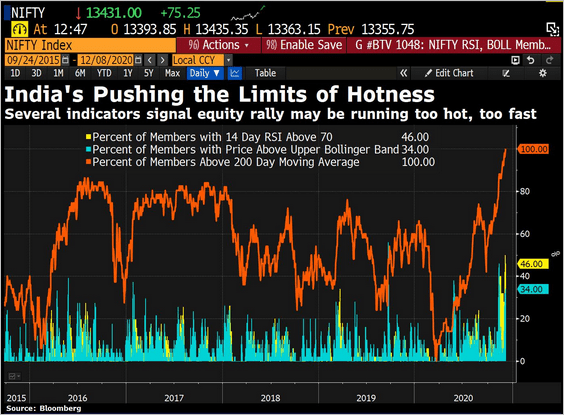
Bloomberg pointed out that among all the impressive breadth readings across the world, India's Nifty 50 index is sporting among the best.

The data go back to 2002, so looking at all other times that at least a third of stocks in the index were overbought and outside their upper Bollinger Band, and at least 95% of them were in uptrends, there were only 2 precedents. Both led to hefty losses over the next 2-3 months then saw the uptrends resume.

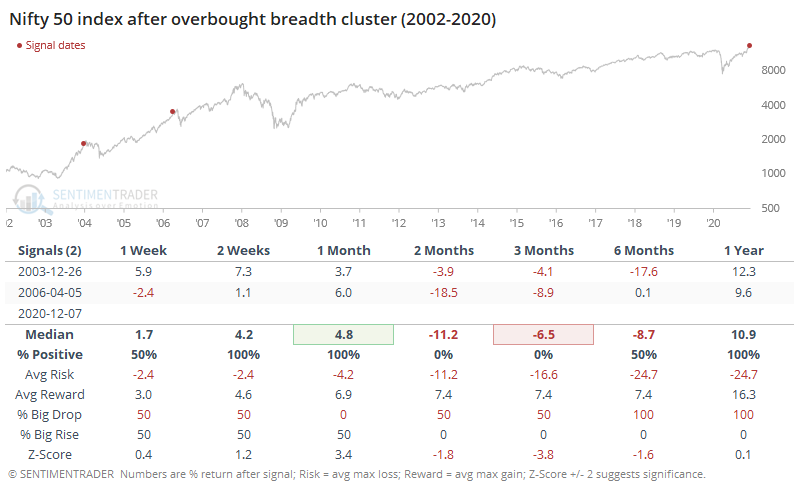
If we relax the parameters to 30% of stocks overbought and outside their volatility bands, and 90% in uptrends, then it was a similar pattern - more short-term follow-through, with some medium-term pullbacks to work off the overbought conditions, and double-digit gains over the next year.


Sorry, you don't have access to this report

Upgrade your subscription plan to get access
Go to Dasboard
PRODUCTS
SentimenTrader
Trading Tools
Indicators & Data API
‍
Strategies & Scanner
‍
Research Reports
FREE
RESOUrCES
Simple Backtest
Calculator
Simple Seasonality
Calculator
The Kelly Criterion
Calculator
Sentiment Geo Map
‍
Public Research Reports
‍
Pricing
Bundle pricing
‍
Announcements
‍
FAQ
COMPANY
‍
About
‍
In the News
‍
Testimonials
‍
Client Success Stories
CONTACT
‍
General Inquiries
‍
Media Inquiries
‍
Financial Professionals Inquiries
‍
© 2025 Sundial Capital Research Inc. All rights reserved.
Setsail Marketing
TermsPrivacyAffiliate Program
Risk Disclosure: Futures and forex trading contains substantial risk and is not for every investor. An investor could potentially lose all or more than the initial investment. Risk capital is money that can be lost without jeopardizing ones’ financial security or life style. Only risk capital should be used for trading and only those with sufficient risk capital should consider trading. Past performance is not necessarily indicative of future results.

Hypothetical Performance Disclosure: Hypothetical performance results have many inherent limitations, some of which are described below. No representation is being made that any account will or is likely to achieve profits or losses similar to those shown; in fact, there are frequently sharp differences between hypothetical performance results and the actual results subsequently achieved by any particular trading program. One of the limitations of hypothetical performance results is that they are generally prepared with the benefit of hindsight. In addition, hypothetical trading does not involve financial risk, and no hypothetical trading record can completely account for the impact of financial risk of actual trading. for example, the ability to withstand losses or to adhere to a particular trading program in spite of trading losses are material points which can also adversely affect actual trading results. There are numerous other factors related to the markets in general or to the implementation of any specific trading program which cannot be fully accounted for in the preparation of hypothetical performance results and all which can adversely affect trading results.

Testimonial Disclosure: Testimonials appearing on this website may not be representative of other clients or customers and is not a guarantee of future performance or success.