Minutes Digest for Jan 28 2021

Big Drop in NAAIM Exposure Index
- Published:
2021-01-28 14:21:25 - Author: Dean Christians
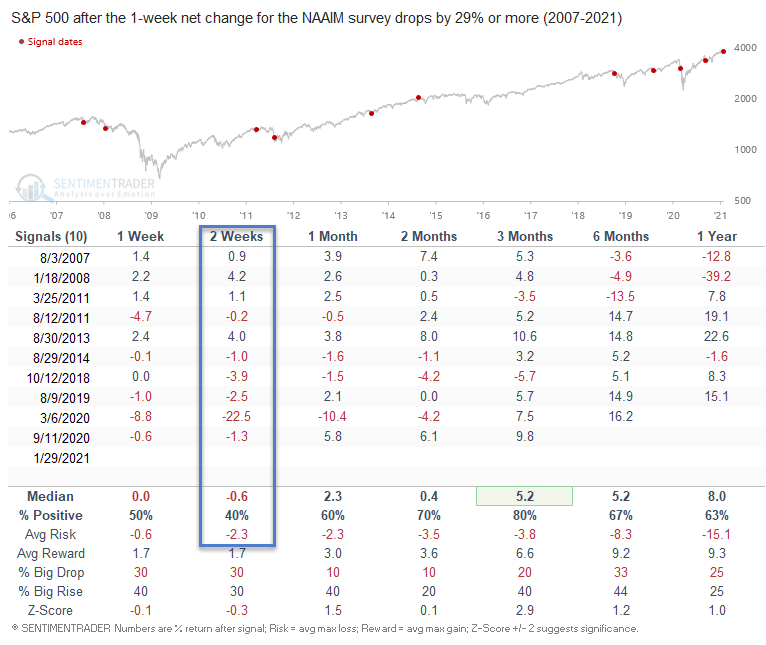
The National Association of Active Investment Managers reported the latest reading for the Exposure Index today. The Index dropped by 29.42% on a w/w basis.
Let's take a look at all other instances when the Index dropped by 29% or more.
Signal Performance
While the sample size is small, the results show weak conditions in the two-week time frame. The results confirm some other studies that Jason and I have noted in the last few days. One should not rule out some choppy conditions in the near-term. Please note, 2014 is the only other time a signal occurred in the same week as a new high.
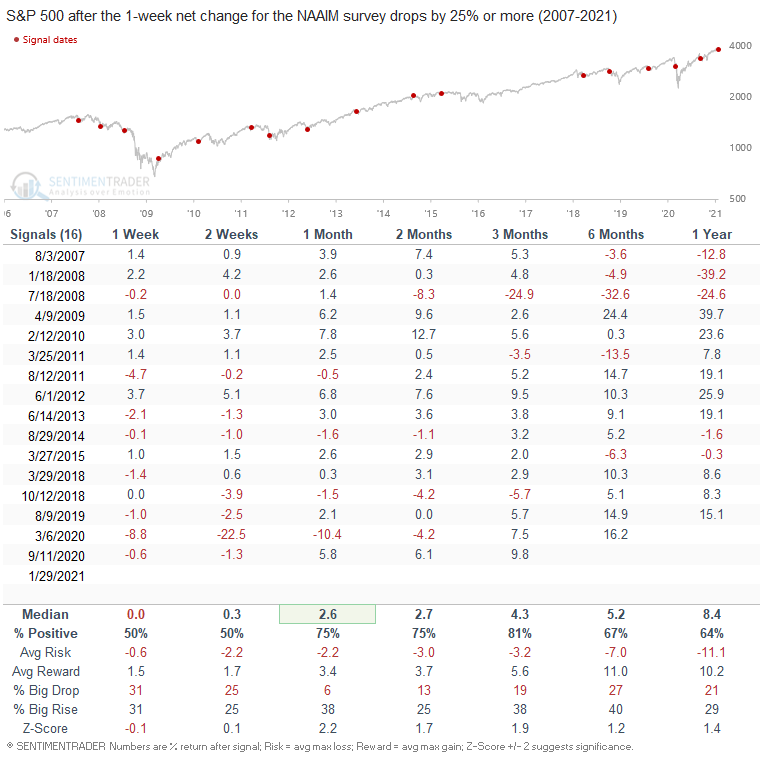
Let's lower the threshold level to 25% and take a look at the signal. Short-term results in the 1-2 week timeframe continue to show a slight negative bias. The results in the 1-3 month timeframe are much better.
Junk isn't confirming the fear
- Published:
2021-01-28 09:17:29 - Author: Jason Goepfert
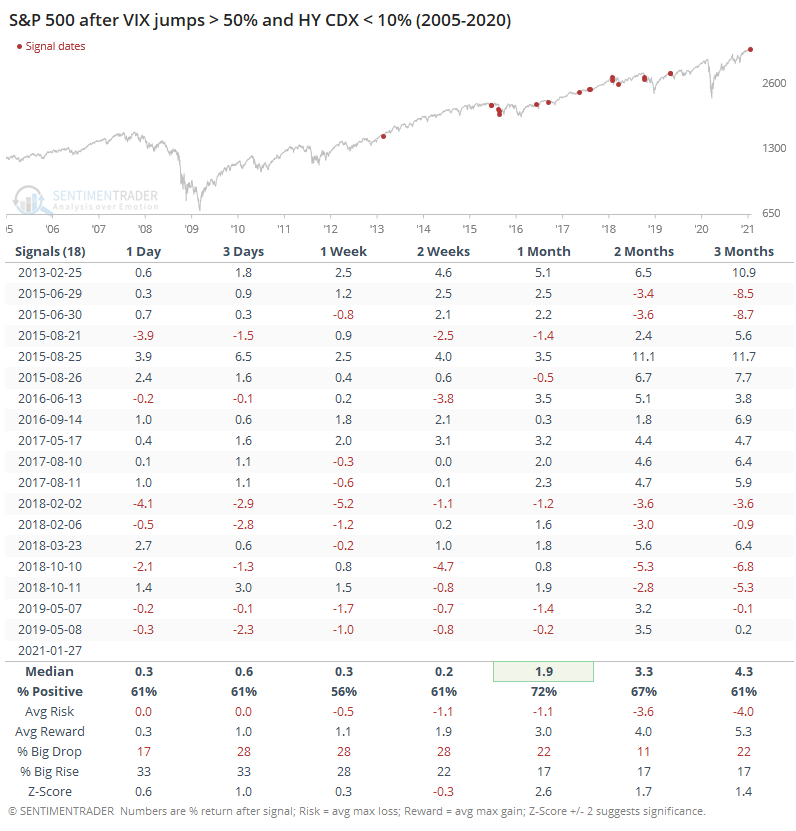
Dean has pointed out in previous notes that the high-yield bond market is still looking relatively healthy. While not a perfect leading indicator, we do often see trouble brewing in that market before we do in stocks.
That's why it's interesting that the big spike in the VIX "fear gauge" for stocks wasn't confirmed by a similar move in high-yield credit default swap prices. The VIX jumped nearly 75% from its 5-day low while the HY CDX didn't even rise 10%.
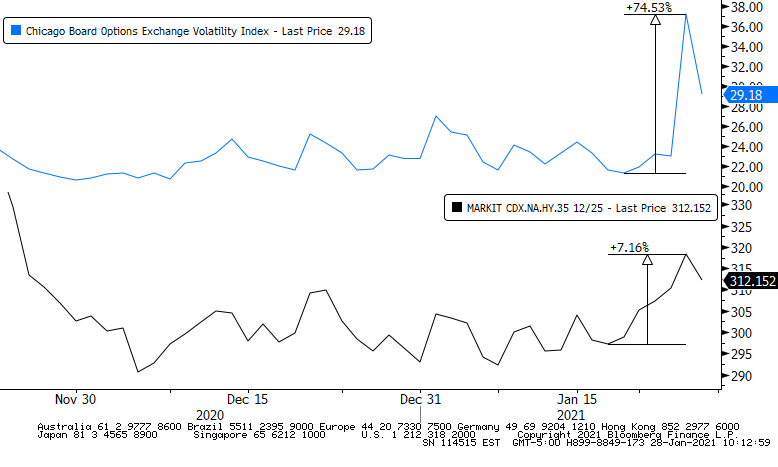
This is been a modestly good sign for the shorter-term.
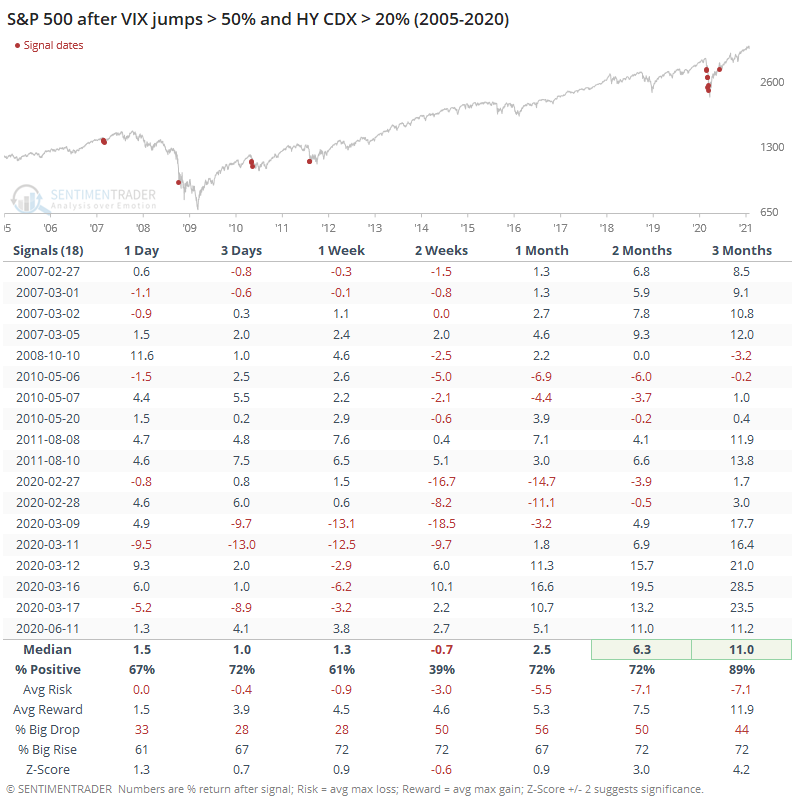
When we do see the CDX jumping along with the VIX, it's usually been during bigger volatility events, so returns over the next couple of weeks were worse, but over the next few months, were better.
Again, not a perfect signal by any stretch, but we should be a bit more worried about imminent trouble if/when CDX starts jumping, too.
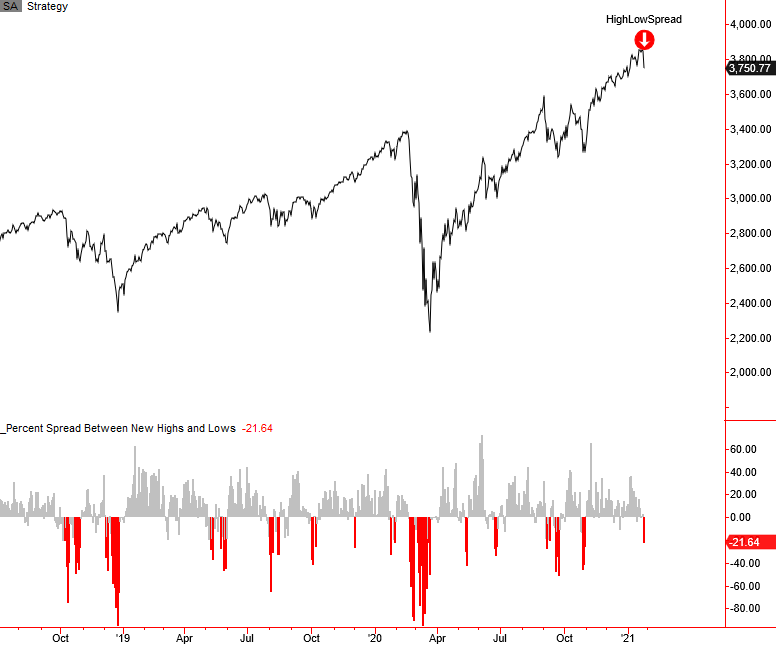
S&P 500 Spread Between 21-Day Highs & Lows
- Published:
2021-01-28 08:59:04 - Author: Dean Christians
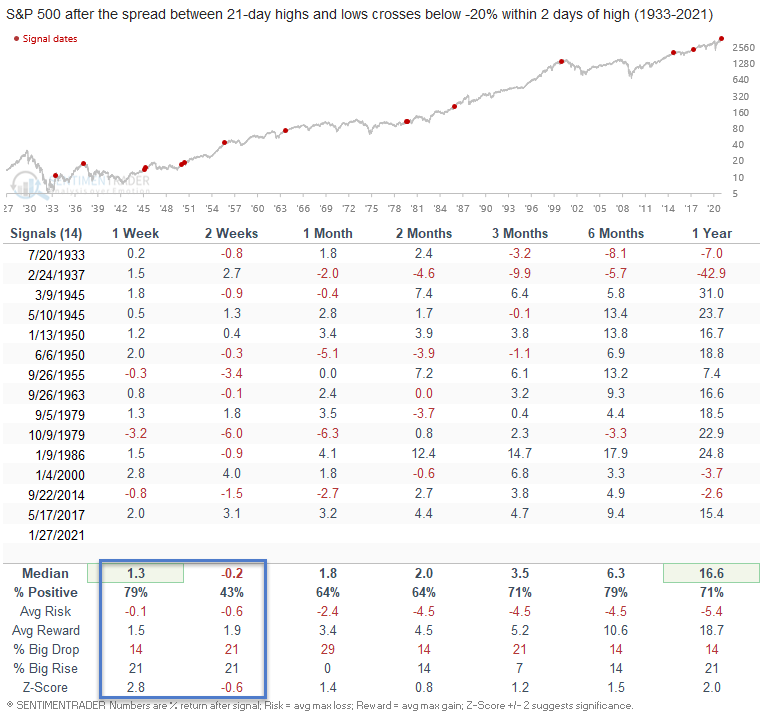
The spread between 21-day highs and lows for S&P 500 members crossed below -20% on 1/27/21. The signal occurred within two days of a high and when the Index was down less than 3% from a 252-day high.
Let's take a look at all instances since 1933.
Current Day Chart and Signal
Signal Performance
As the table below shows, the S&P 500 tended to snapback over the next week. Some weakness then followed the rally in the two-week timeframe.