
Mid-term years split personality

Key Points
- Mid-term years have a demonstrated something of a "split personality" over the last 90 years
- The first nine months typically witness a great deal of volatility and often significant market weakness
- The last three months of the year have seen the S&P 500 Index rise 84% of the time
Part 1 - January through April
Many investors got swept up in the euphoria of the rip-roaring bull market that followed the Covid-19 lows in early 2020 and were surprised by the stock market weakness so far this year. But history suggests that we should not be quite so surprised.
The chart below displays the cumulative % price return for the S&P 500 Index held only from January through April during every mid-term election year starting in 1934.
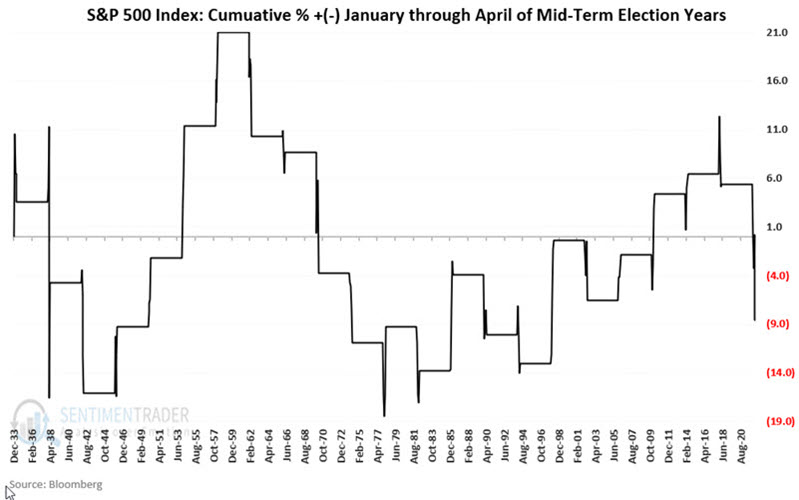
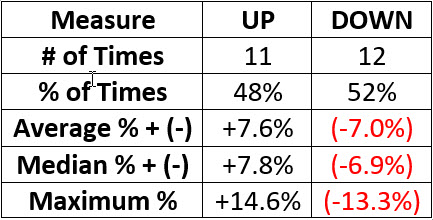
The cumulative % price return for the S&P 500 Index for January through April of mid-term election years starting in 1934 is -8.6%. The table below displays a summary of the results.
Part 2 - May through September
The chart below displays the cumulative % price return for the S&P 500 Index held only from May through September during every mid-term election year starting in 1934.
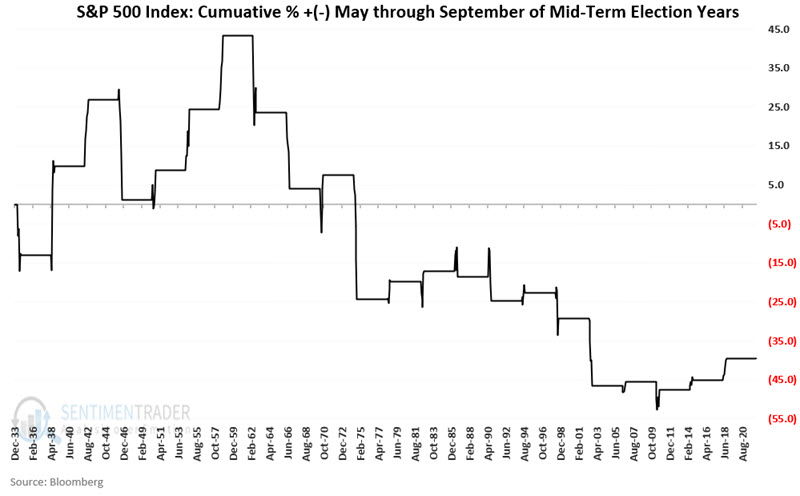
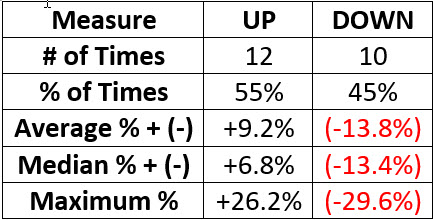
The cumulative % price return for the S&P 500 Index for May through September of mid-term election years starting in 1934 is -39.6%. The table below displays a summary of the results.
Parts 1 and 2 combined - January through September
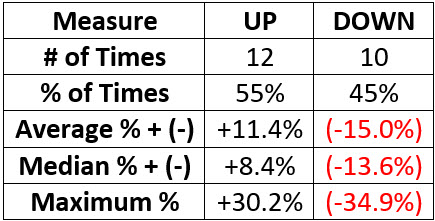
Interestingly, the first nine months of mid-term election years have shown a gain more often (12 times) than a loss (10 times). Unfortunately, the "bad years" have been the scene of some significant wealth destruction for investors.
The chart below displays the cumulative % price return for the S&P 500 Index held only from January through September during every mid-term election year starting in 1934.
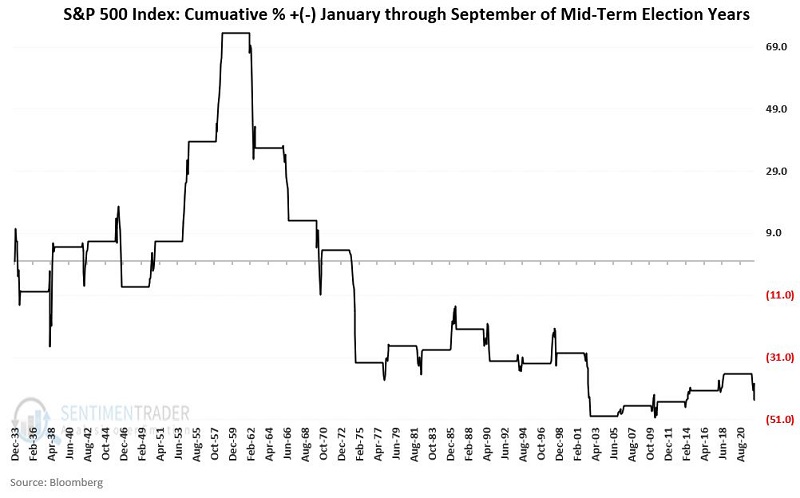
The cumulative % price return for the S&P 500 Index for January through September of mid-term election years starting in 1934 is -44.8%. The table below displays a summary of the results.
Part 3 - October through December
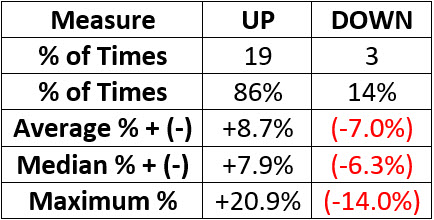
Now, finally, some good news. The chart below displays the cumulative % price return for the S&P 500 Index held only from October through December during every mid-term election year starting in 1934.
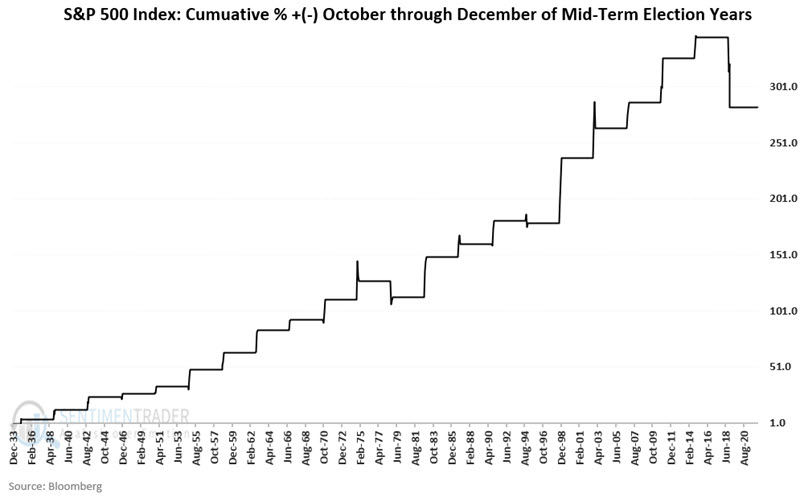
The cumulative % price return for the S&P 500 Index for October through December of mid-term election years starting in 1934 is +282.7%. The table below displays a summary of the results.
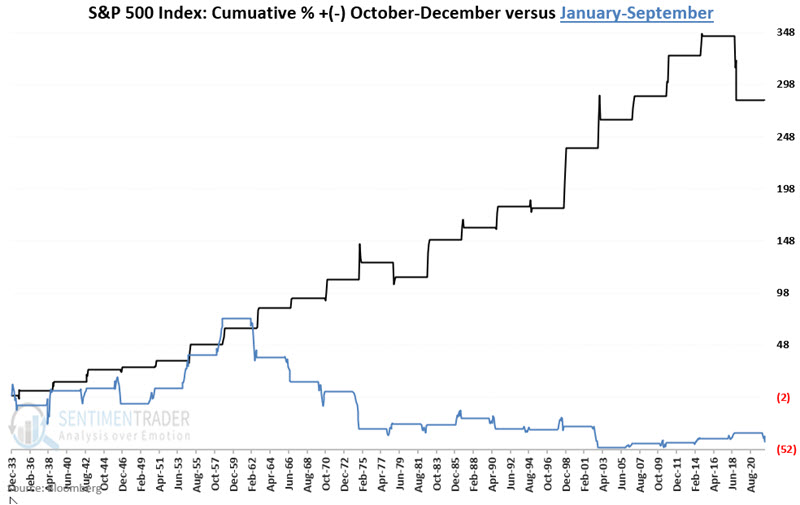
To fully drive home the split personality that tends to mark mid-term election years, the black line in the chart below displays the cumulative Oct-Dec performance (+282.7%). In contrast, the blue line shows the cumulative Jan-Sep performance (-44.8%).
What the research tells us…
Investors are hoping for a quick rebound in the stock market following the sell-off in the first four months of 2022. The market is oversold on a short-term basis and just held support, so a rally in the near term is entirely possible. Nevertheless, as the year progresses, history suggests that some patience may be in order - and that things may get worse before they get better. The "catch" with any seasonal pattern is that there is never the slightest guarantee that it will play out the way it "should" the next time around. Nevertheless, the history of mid-term years suggests that the probability of a sustained advance will increase later in the year.